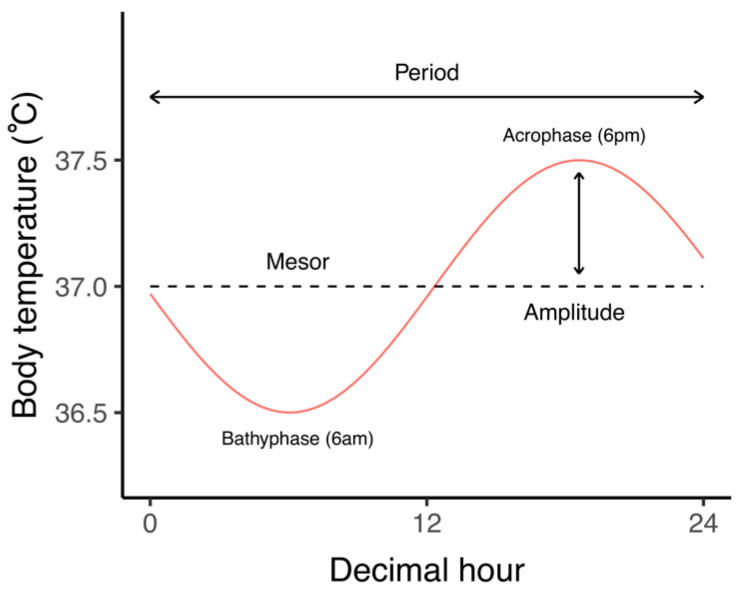
Figure 2.
Circadian parameters of the body temperature. The graph represents the circadian rhythm of the body temperature (red curve). The dashed line represents the mesor (MESOR = Midline Estimating Scheme 24 h for a circadian rhythm). The amplitude is the difference between the mesor and the value at the peak. The acrophase is the time-of-day of the maximum value. The bathyphase is the time-of-day of the minimum value.

