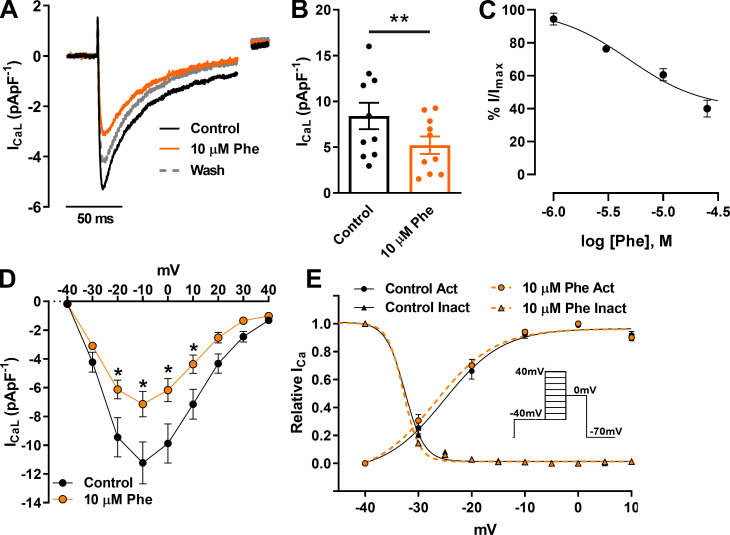
Figure 2.
Effect of 10 µM phenanthrene (Phe) on L-type Ca2+ channel currents (ICaL) in ventricular zebrafish myocytes. (A) Representative current traces. (B) Scatter plot showing mean ± SEM. ICaL density elicited by depolarization to −10 mV (n = 10; N = 3; **, P < 0.01; Wilcoxon test) in absence (control; black) and presence of 10 µM phenanthrene (orange). Dotted line represents current trace of recovery from inhibition after 5 min washout. (C) Concentration–response curve of phenanthrene on ICaL, revealing an IC50 of 4.8 ± 0.8 µM (Hill slope, nH = 1.3 ± 0.2). (D) Peak ICaL density I-V plot (n = 6; N = 2; *, P < 0.05; two-way ANOVA with the Holm–Šídák post hoc analysis). (E) steady-state activation (G/Gmax) and inactivation (I/Imax) obtained using (inset) double-pulse protocol in the absence (control; black) and presence of 10 µM phenanthrene (orange; n = 6; N = 2). Act, activation; Inact, inactivation.

