Figure 3.
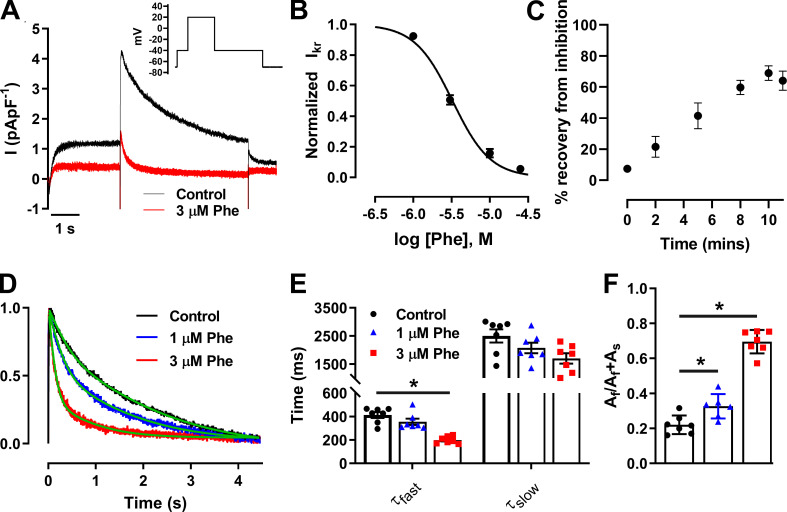
Phenanthrene (Phe) inhibits the native zfERG channel (IKr) and increases rate of channel deactivation. (A) Representative IKr peak tail current trace recorded in absence (black) and presence of 3 µM phenanthrene (red; inset) elicited by voltage protocol. (B) Concentration–response curve of phenanthrene on peak IKr tails, revealing an IC50 of 3.3 ± 0.2 µM (Hill slope, nH = 1.8 ± 0.2). (C) Time-course plot showing a maximum of 69 ± 5% recovery from inhibition by 10 µM phenanthrene after 10 min of washout (n = 6; N = 2). (D) Representative IKr tails (normalized to peak) in the absence (black) and presence of 1 µM (blue) and 3 µM (red) phenanthrene, fitted to a standard double exponential curve (green), to evaluate rate of current decay. (E and F) Bar plot presenting time-constant values of fast- and slow-deactivating current components (τfast and τslow, respectively; E; P < 0.01) and proportion of amplitude of fast-deactivating current component (Af) as a fraction of total amplitude of fast- and slow-deactivating current component (Af + As) obtained from fitting (F) show significant decrease in τfast and corresponding increase in Af component with increasing concentration in phenanthrene (n = 7; N = 2; *, P < 0.05; Wilcoxon test).

