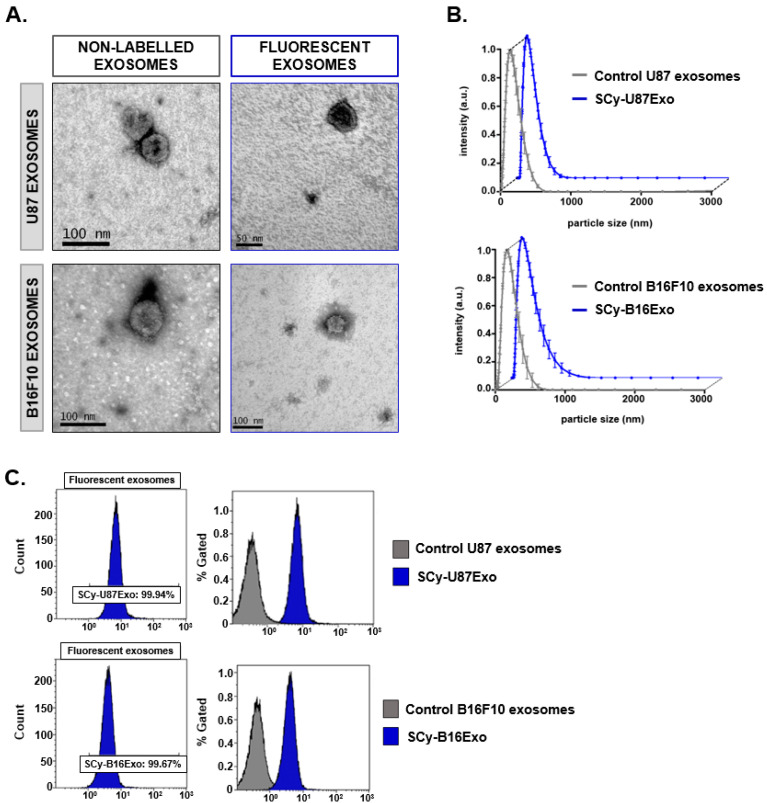
Figure 2.
Physicochemical characterization of control and fluorescence-labeled cancer cell line-derived exosomes. (A) Transmission electron microscope images show the nanovesicle morphology. (B) Size distributions of exosomes produced with dynamic light scattering. Data are expressed as the mean ± standard deviation. (C) Flow cytometry results show abundances of control exosomes and the fluorescent nano-probes. SCy: sulfo-cyanine 7.5; U87Exo: exosomes derived from U87 glioblastoma cells; B16Exo: exosomes derived from B16F10 mouse melanoma cells.

