
FIGURE 4.
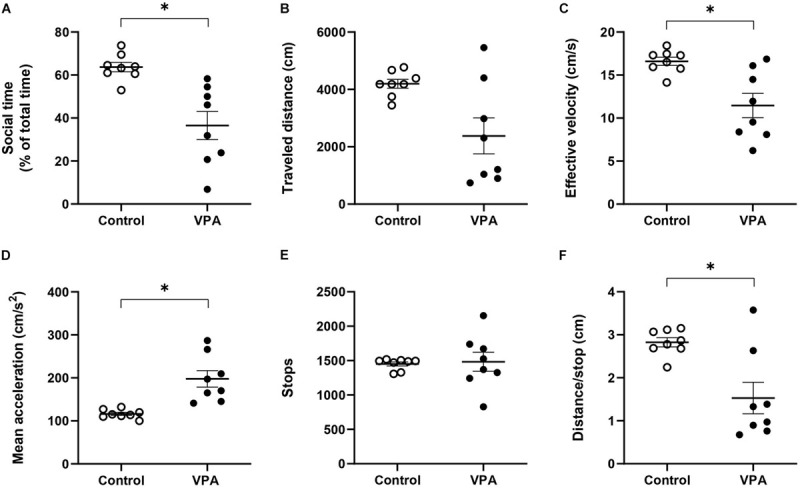
Effect of prenatal VPA treatment on (A) social time and kinematic parameters in the social stage of the 3C-ST; (B) “traveled distance,” (C) “effective velocity,” (D) “mean acceleration,” (E) “stops,” and (F) “distance/stop”. ∗p < 0.05; Mann-Whitney U-test, VPA compared to controls. n controls = 8 and n VPA = 8.