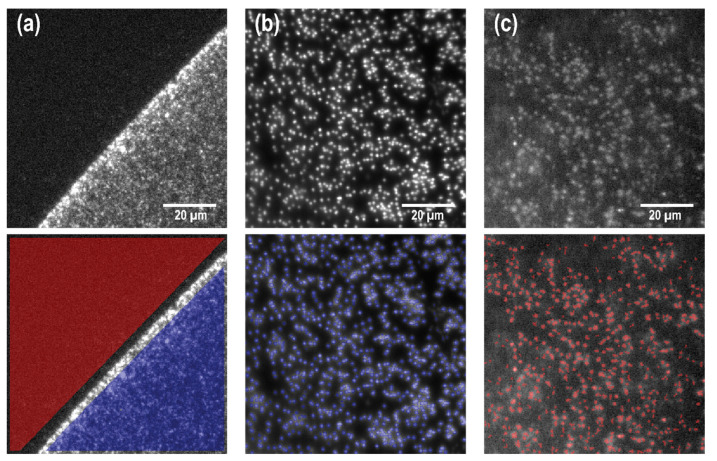
Figure 3.
Image analysis for signal extraction on (a) MaxiSorp black polymer plastic spotted with antibodies and exposed to 0.4% serum concentration, (b) scFv-spotted nanowires exposed to 0.4% serum concentration, and (c) non-spotted nanowires exposed only to 0.4% serum concentration (control sample). Panel (a) is displayed in a different pixel window than panels (b,c) to better show the contrast between spotted and non-spotted areas in (a). On flat substrates, the signal and background intensity are extracted as the mean pixel value in the areas inside (blue) and outside (red) the scFv spot, respectively. On nanowire samples, Is is the mean pixel intensity on nanowire positions, (highlighted in blue in (b)). Similarly, IB is the mean pixel intensity on nanowire positions on the control substrate (red in (c)).

