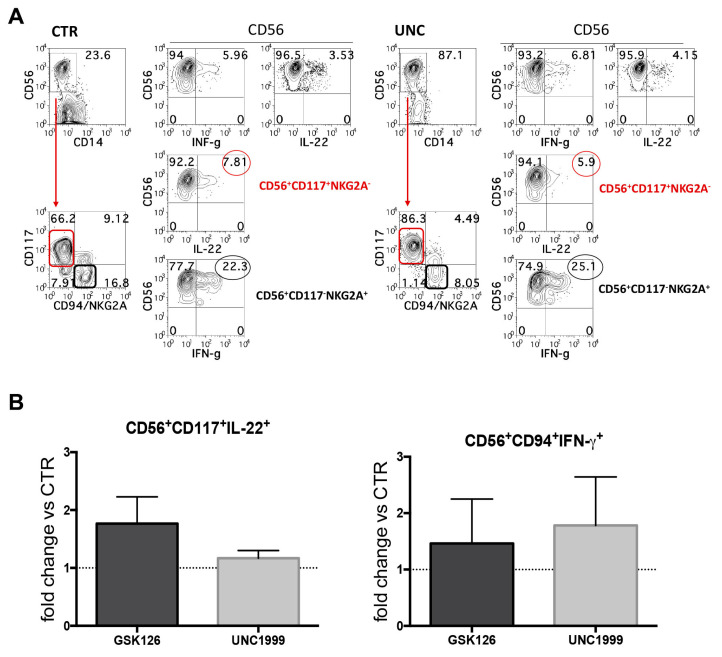
Figure 3.
Cytofluorimetric analyses of intracytoplasmic cytokines in CD14−CD56+ cells that underwent differentiation in the absence or in the presence of UNC1999 or GSK126. (A,B) After 25 days of culture, cells were stimulated overnight with IL-1β+IL-7+IL23 or IL12+IL-15+IL-18 to induce the expression of IL-22 or IFN-γ respectively. (A) Upper contour plots show the intracytoplasmic staining of IL-22 and IFN-γ cytokines expressed by CD14−CD56+ cells. Lower contour plots show the percentages of CD14−CD56+CD117+CD94/NKG2A-IL-22+cells (red) and CD14−CD56+CD117−CD94/NKG2A+IFN-γ+ cells (black) detectable in cultures performed in the absence (CTR) or in the presence of UNC1999 1 μM (UNC). Representative experiment out of five. (B) The histograms show the fold change of CD14−CD56+CD117+CD94/NKG2A−IL-22+ and CD14−CD56+CD117−CD94/NKG2A+IFN-γ+ cells detected in cultures performed in the presence of GSK126 1 μM (GSK) or UNC1999 1 μM (UNC) after 25 days of culture as compared to CTR, arbitrarily normalized to one. Data are expressed as mean values ± SEM obtained in five independent experiments and analyzed by Wilcoxon Signed Rank Test.

