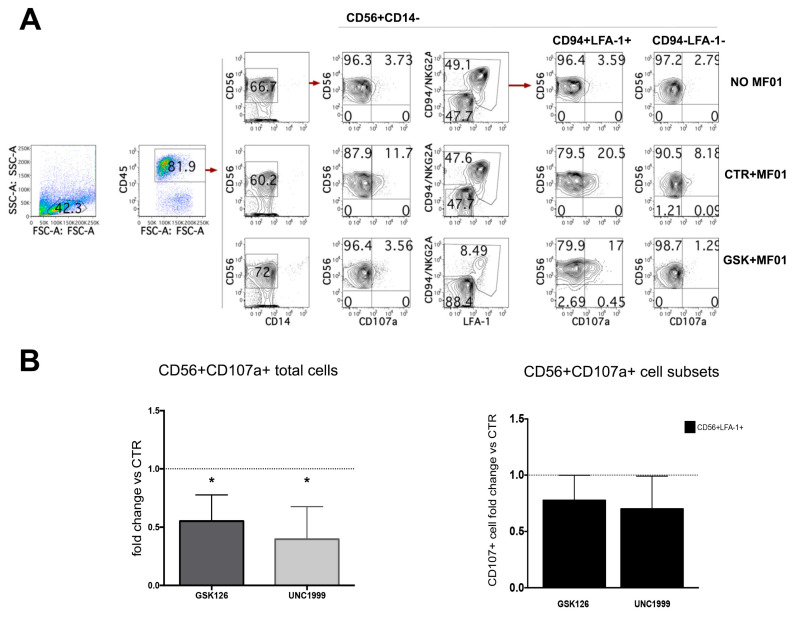
Figure 4.
After 27 days of culture, CD14−CD56+ cells were incubated with the NK-susceptible human melanoma cell line MFO1 and analyzed for the expression of CD107a. (A) Dot Plots show CD107a staining on CD45+CD56+CD14− cells and on relative LFA-1+CD94+ and CD94−LFA-1− cell subsets after incubation with MFO1 cell lines. A representative experiment performed with GSK126 is shown. (B) The left histogram shows the fold change of total CD56+CD107a+ cell percentages detectable in cultures performed the presence of GSK126 1 μM (GSK) or UNC1999 1 μM (UNC) as compared to CTR condition, arbitrarily normalized to one. The right histogram represents the fold change of CD56+CD94+LFA-1+ CD107a+ cell percentages detectable in cultures performed the presence of GSK126 1 μM (GSK) or UNC1999 1 μM (UNC) as compared to CTR condition, arbitrarily normalized to one. Effector/target (E/T) cell ratio was 1/1 (see Methods section). Data are expressed as mean values ± SD obtained by eight independent experiments and analyzed by Wilcoxon Signed Rank Test (* p < 0.05).

