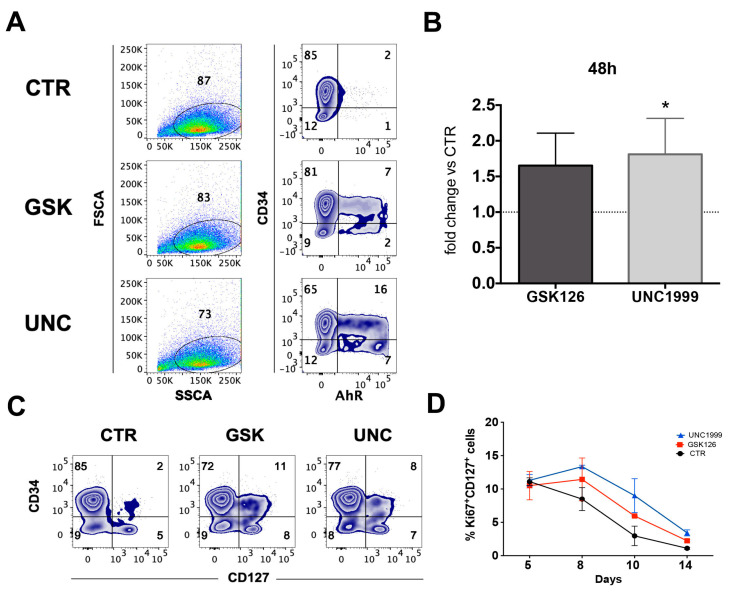
Figure 5.
Early time intervals analyses of AhR TF and CD107a surface marker in UCB-CD34+ cell precursors cultured in the absence or in the presence of UNC1999 and GSK126. (A) Zebra plots show the intranuclear staining of AhR TF expressed by UCB-CD34+ cell precursors in the absence (CTR) or in the presence of GSK126 1 μM (GSK) or UNC1999 1 μM (UNC) after 48 h of culture. Representative experiment out of six. (B) The histograms represent the fold change of CD34+CD117+AhR+ cell percentages detectable in the presence of GSK126 1 μM (GSK) or UNC1999 1μM (UNC) after 48 h of culture as compared to CTR condition, arbitrarily normalized to one. Data are expressed as mean values ± SEM obtained by of 6 independent experiments. (C) Zebra plots show the surface staining of CD127 (IL-7Rα) expressed by CD34+ cells in the absence (CTR) or in the presence of GSK126 1 μM (GSK) or UNC1999 1 μM (UNC) after 48 h of culture. Representative experiment out of four. (D) Time course shows the percentages of CD127+ cells stained with Ki67 proliferation marker in the absence or in the presence of GSK126 1 μM (GSK) or UNC1999 1 μM (UNC) between 5 and 14 days of culture. Data are the mean values ± SEM of two independent experiments.

