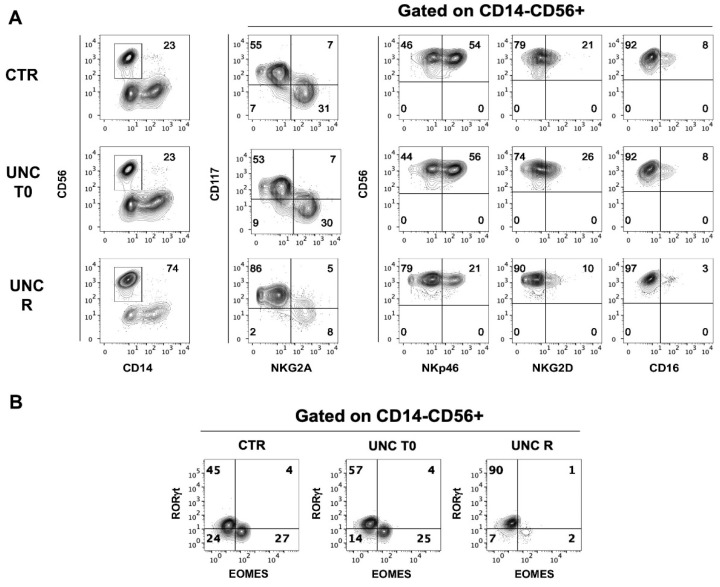
Figure 8.
Phenotypic analyses of CD56+ cells generated in the absence or in the presence of UNC1999 added at different time intervals. (A) Flow cytometric analyses show surface staining of surface markers expressed by CD14−CD56+ cells obtained after 25 days of culture in the absence (CTR) or in the presence of UNC1999 1 μM (UNC) added at the beginning of the culture (UNC T0) or added twice/week to the cell culture (UNC R). Representative experiments out of five. (B) Contour plots show the intranuclear staining of Eomes and RORγt TF expressed by CD14−CD56+ cells obtained after 25 days of culture in the absence (CTR) or in the presence of UNC1999 1 μM (UNC) added at the beginning of the culture (UNC T0) or added as a chronic simulation (UNC R). Representative experiments out of five.

