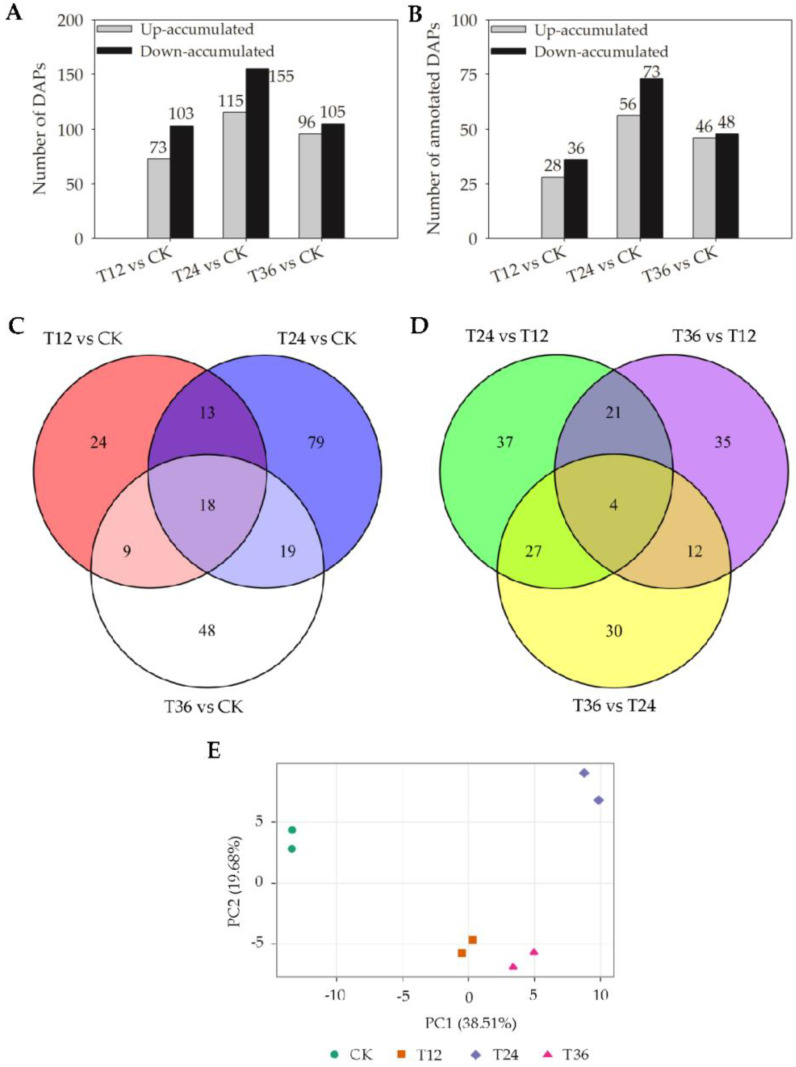
Figure 5.
Number of differentially abundant proteins (DAPs) quantified in embryos of melatonin-primed seeds and aged seeds. (A) All DAPs between melatonin treatments and control; (B) Annotated functional DAPs between melatonin treatments and control; (C) Venn diagram of annotated functional DAPs comparing melatonin treatments and control; (D) Venn diagram of annotated functional DAPs comparing individual melatonin treatments; and (E) PCA analysis of annotated DAPs’ abundance of melatonin-primed seeds (T12, T24, and T36) and aged seeds (CK).

