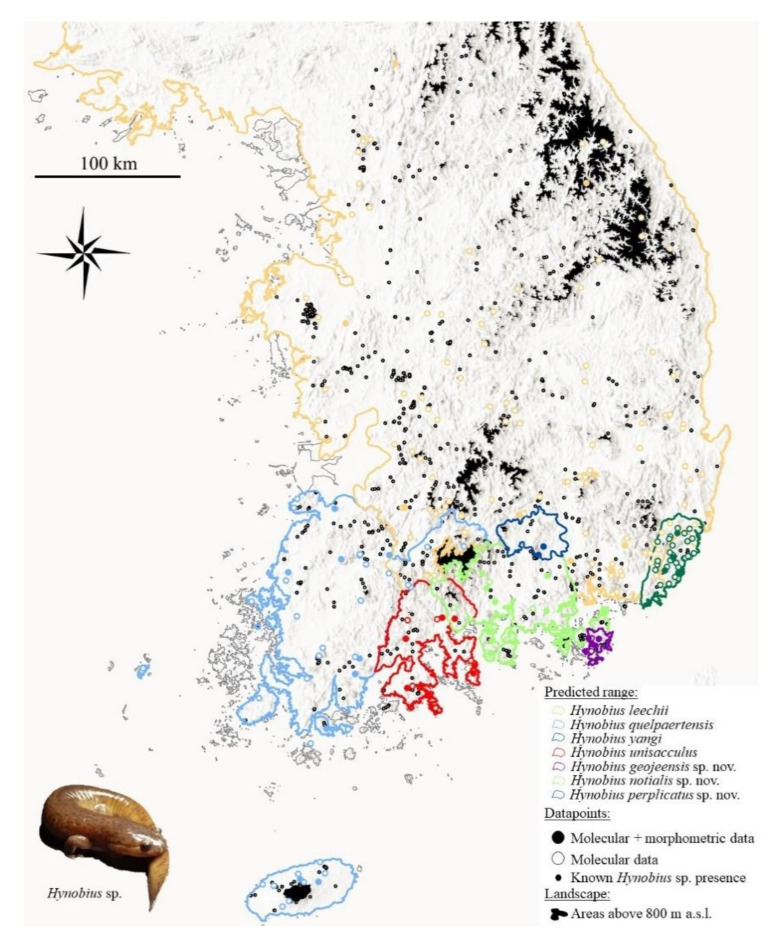
Figure 1.
Sampling sites and predicted ranges. Map representative of sites with molecular and morphometric data, molecular data only and presence of Hynobius sp. The predicted ranges are drawn to be continuous until landscape barriers preventing the dispersion of the genus (>800 m a.s.l. and sea water). As there was more than one sample per site, the number of points on the map does not match with the number of individuals sampled. Map created in ArcMap 10.6 (desktop.arcgis.com; ESRI, Redlands, CA, USA).

