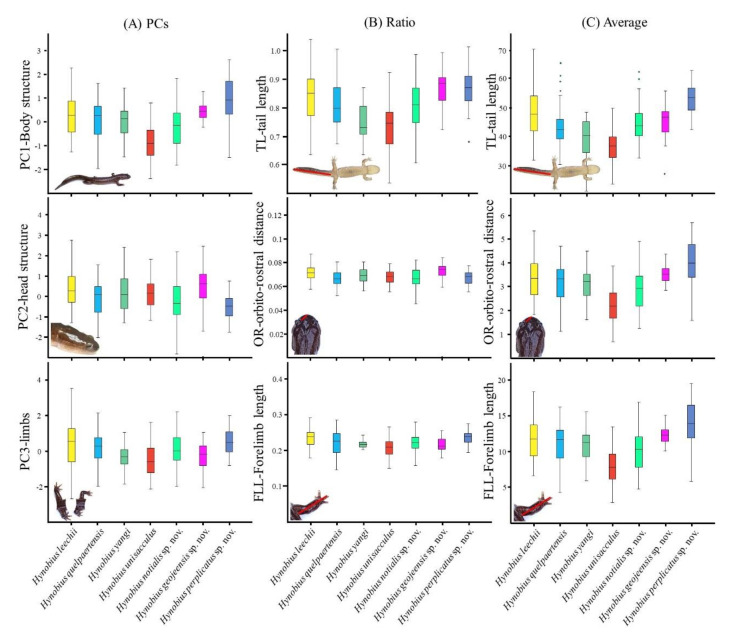
Figure 2.
Box plots of morphological variables of importance segregated by clade. This figure includes values for PCs resulting from the PCA (A), ratios when morphological traits were controlled by size (B) and averages of real size (C). Only PC1, PC2 and PC3 are presented, as PC4 was not significantly different based on clade, and the variables TL, OR and FLL are used here as proxies for PC1, 2 and 3 respectively, due to their highest loading values.

