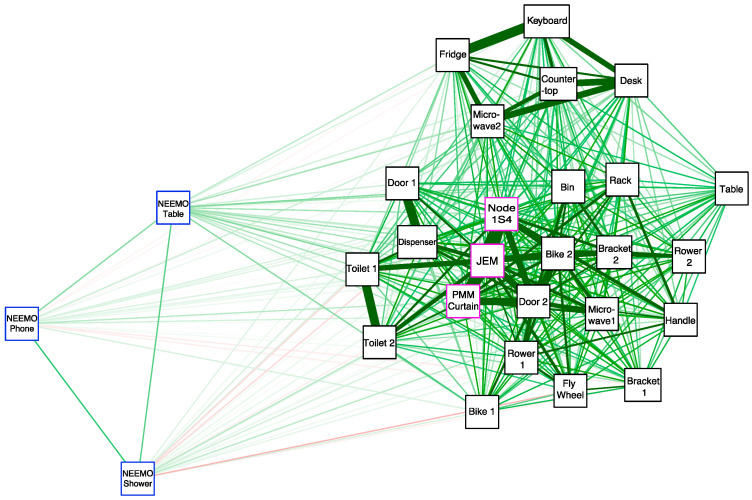
Figure 6.
Spearman correlation network showing the associations between swabs collected onboard the ISS (outlined in pink) from the Aquarius Habitat on the seafloor (outlined in blue) and from the Human Health and Performance Laboratory building at the NASA Johnson Space Center (outlined in black). Sample association shown from high to low with green to red color and thick to thin lines.

