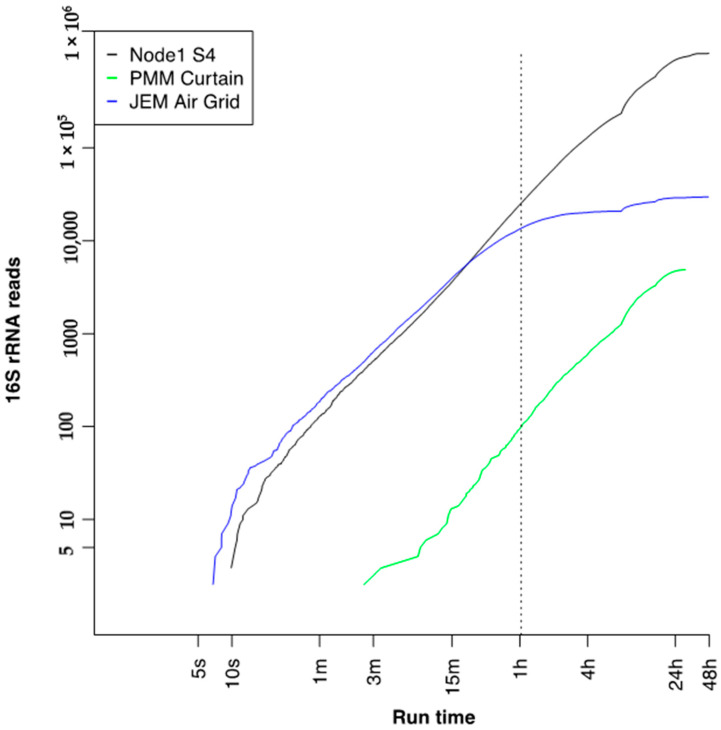
Figure 7.
16S reads accumulated over time per three swab-to-sequencer runs onboard the International Space Station. The dotted line represents time when the same top suggested species diversity was recorded as at completion of the run (Supplemental Figure S4).

