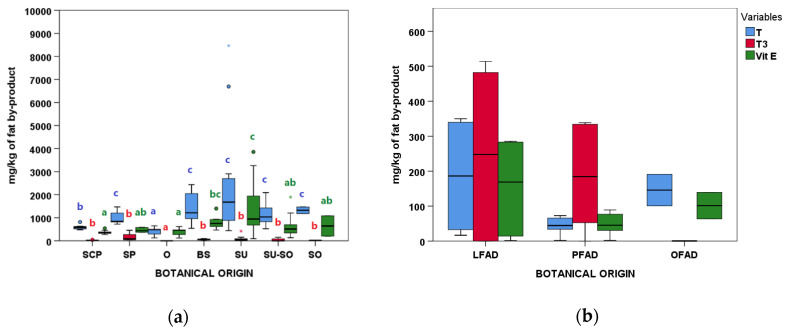
Figure 6.
Tocopherols (T), tocotrienols (T3), and Vitamin E content according to botanical groups for (a) acid oils from chemical refining (n = 79) and (b) fatty acid distillates from physical refining (n = 13) (see Table 1 for botanical group abbreviations). Within each type of refining and variable, botanical groups bearing different letters (a–c) are significantly different according to Kruskal–Wallis test and post-hoc comparisons (p ≤ 0.05).

