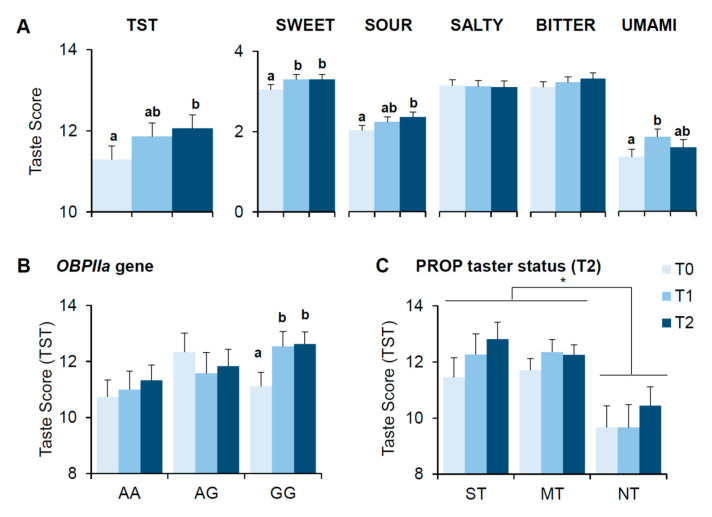
Figure 2.
Taste perception scores determined before (T0), one month (T1) and six months (T2) after bariatric surgery. Means (±SEM) values of the total taste score of the whole Taste Strip Test (TST) and of that relative to sweet, sour, salty, bitter and umami (n = 51) (A). Data of the total taste score of the whole TST are shown according to the rs2590498 polymorphism of OBPIIa gene (genotypes AA: n = 15; genotypes AG: n = 12; genotypes GG: n = 24) (B) or PROP taster status determined at T2 (super-tasters: n = 11; medium tasters: n = 31; non-tasters: n = 9) (C). Different letters indicate a significant difference (p ≤ 0.048, Fisher’s test LSD subsequent repeated measures ANOVA). * indicate a significant difference between values of tasters and non-tasters (p ≤ 0.027 Fisher’s test LSD subsequent repeated measures ANOVA).

