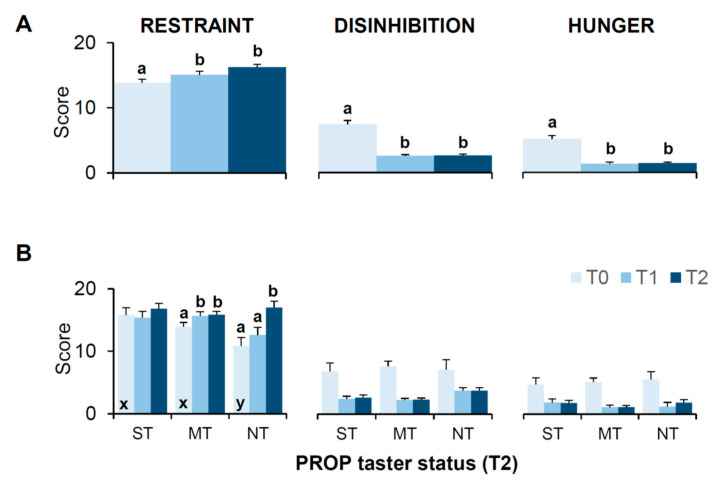
Figure 5.
Mean (± SEM) values of the scores of the Three-Factor Eating Questionnaire (TFEQ) determined before (T0), one month (T1), and six months (T2) after bariatric surgery (A). The same data are shown for each PROP taster group determined at T2 (super-tasters: n = 11; medium tasters: n = 31; non-tasters: n = 9) (B). Significant differences are indicated by different letters: a and b are used to denote differences within sampling time (T0, T1 or T2), while x and y are used to denote differences with respect to the corresponding value of other groups. For all comparisons (p ≤ 0.027, Fisher’s test LSD subsequent repeated measures ANOVA).

