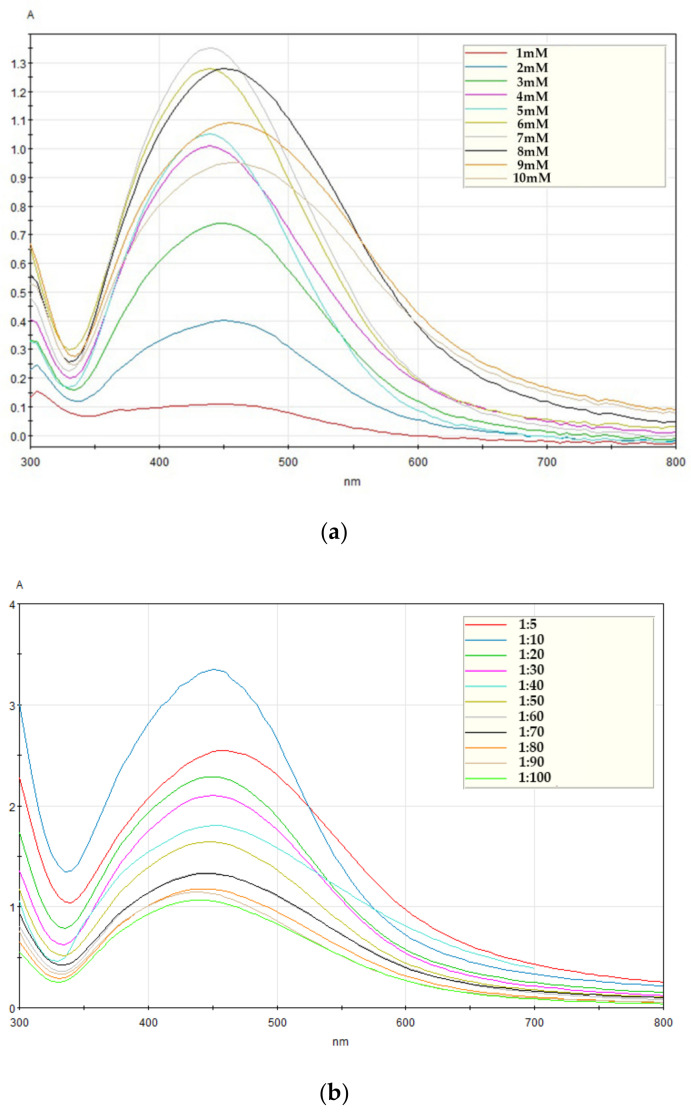
Figure 2.
Absorbance spectra of AgNPs using A. catechu extract. (a) Absorbance spectra according to various AgNO3 solution concentrations, (b) absorbance spectra according to various mixing ratios, and (c) color changes in the mixture according to reaction time and (d) time-dependent absorbance patterns of the mixture (A. catechu extract:7 mM AgNO3 solution, 1:10).


