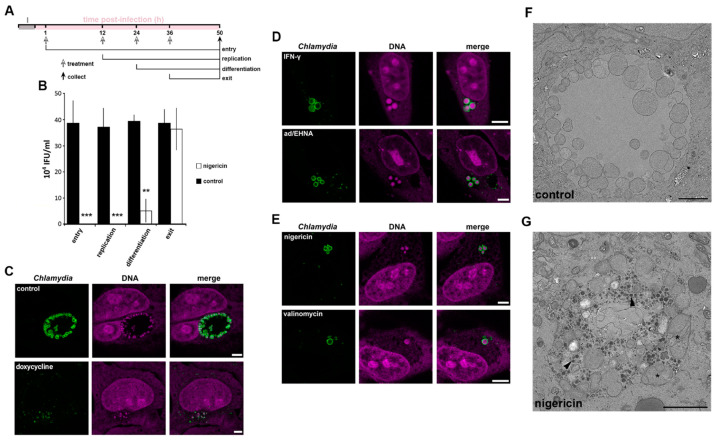
Figure 3.
Effect of K+ ionophores on chlamydial infectivity and morphology. HeLa cells were infected with C. trachomatis LGV2. (A) Schematic of the experiment design associated with panel B. I: infection. Time of treatment, corresponding to the different phases of the Chlamydia lifecycle as indicated, and collection have been determined based on the titration assay (Figure 2D). (B) Infected cells were treated with nigericin (white bars) or untreated (black bars) at the indicated phase of the lifecycle (x-axis) and samples collected at 50 hpi. Infectivity was assessed and IFU/mL indicated on the y-axis. ** p < 0.01, *** p < 0.005. Error bars: standard deviation. For (C–E) cells were treated as indicated at 12 hpi and fixed at 24 hpi prior to labelling with anti-Chlamydia (green) and DNA probe (magenta). Scale bar: 5 µm. (C) upper panels: non-treated, lower panels: doxycycline (D) upper panels: IFN-γ lower panels: adenosine (Ad/EHNA) (E) upper panels: nigericin, lower panels: valinomycin. (F,G) control infected cells (F) or treated at 12 hpi with nigericin (G) prior to processing for transmission electron microscopy at 24 hpi. Scale bar: 2 µm.

