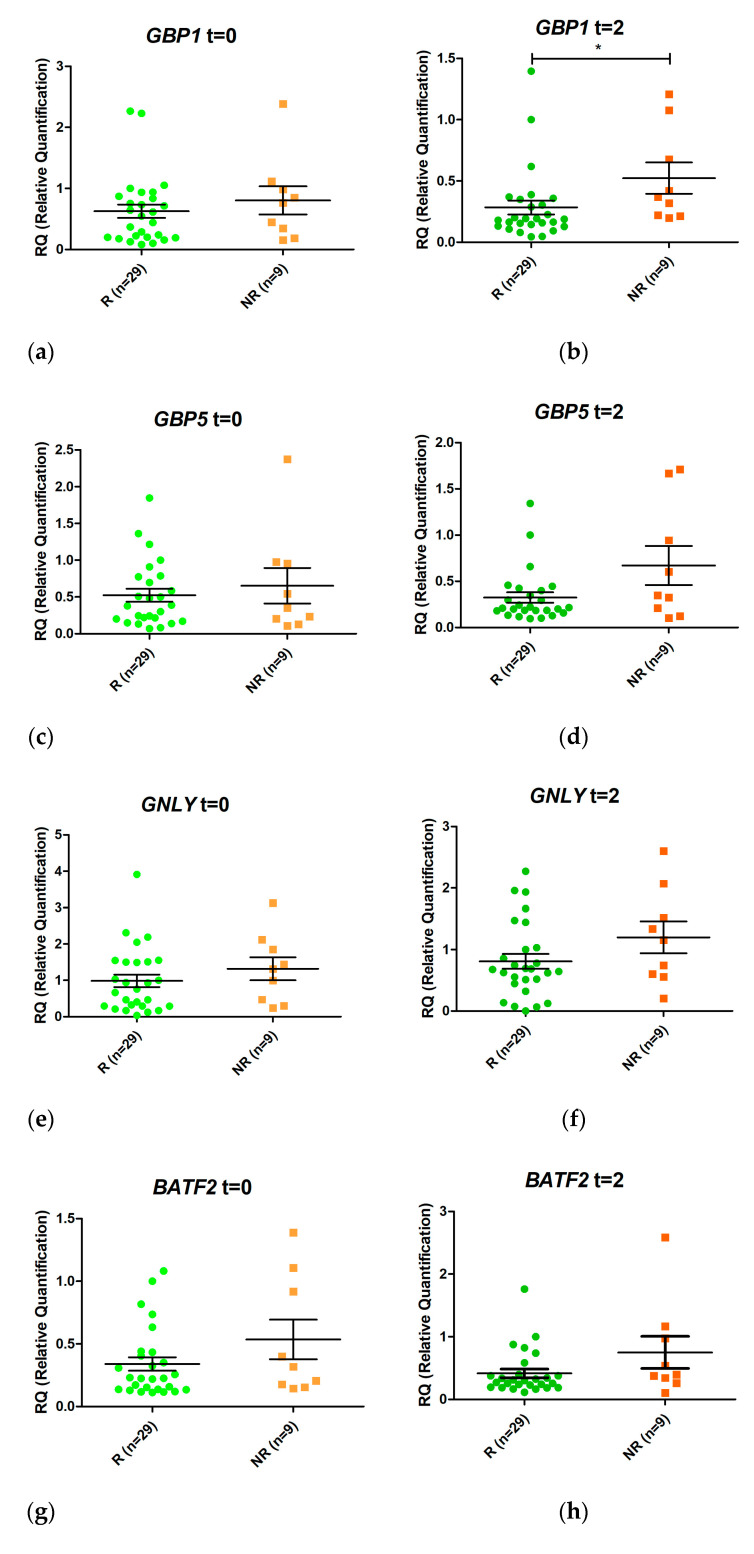
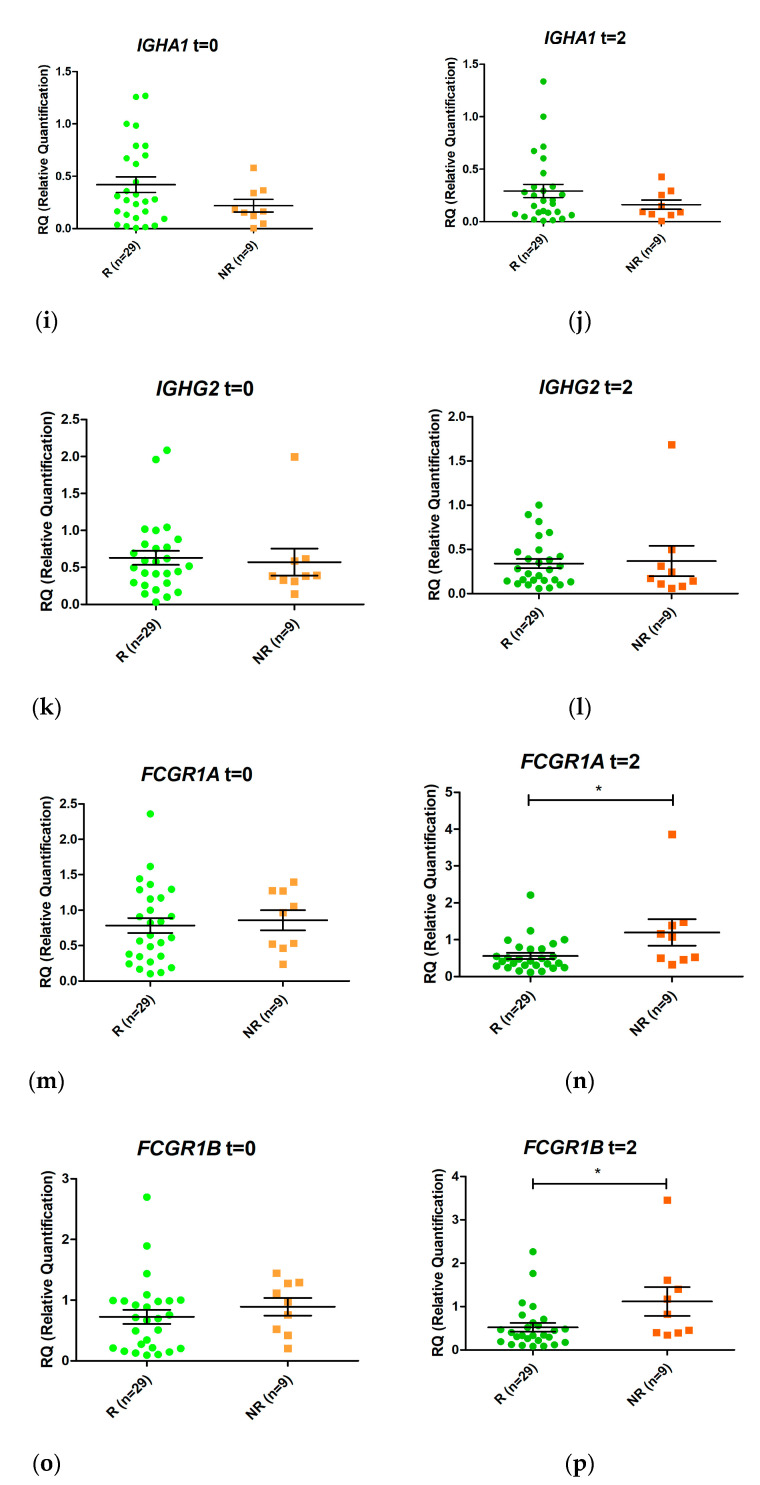
Figure 3.
Relative expression levels of the genes GBP1 (a,b), GBP5 (c,d), GNLY (e,f), BATF2 (g,h), IGHA1 (i,j), IGHG2 (k,l), FCGR1A (m,n), and FCGR1B (o,p) in responders (R, green) and non-responders (NR, orange) at time 0 (t = 0) and at two weeks (t = 2) after initiation of anti-TNF therapy. Expression values were normalized to the ACTB and RPL4 genes. Values are expressed as mean (horizontal line) and standard error of the mean (SEM); n, sample size; * p value < 0.05 vs. control (unpaired t test).


