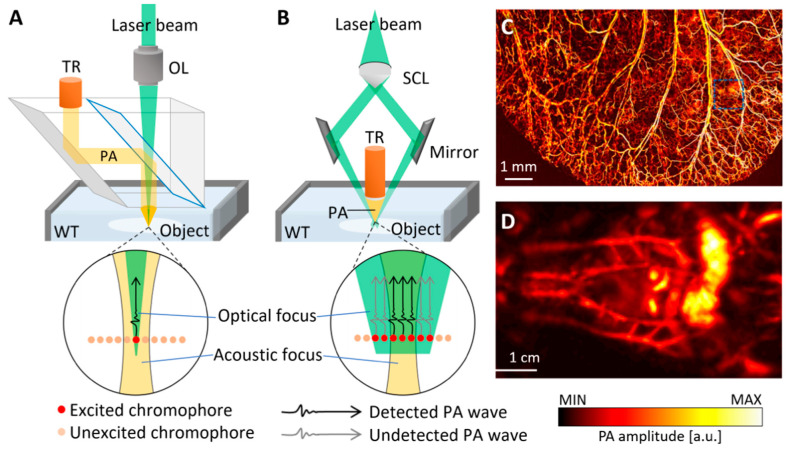
Figure 3.
Schematic illustration and representative images of OR- and AR-PAM systems. The typical configurations of (A) OR-PAM and (B) AR-PAM. The optical focus is smaller than the acoustic focus in OR-PAM, while the optical focus is larger than the acoustic focus in AR-PAM. The red and orange dots are excited and unexcited chromophores, respectively. The black and gray arrows are detected and undetected PA waves, respectively. (C) PA images of mouse ear acquired using an OR-PAM. (D) PA images of the whole body of mouse acquired using an AR-PAM. OR-PAM, optical resolution photoacoustic microscope; AR-PAM, acoustic resolution photoacoustic microscope; PA, photoacoustic; TR, ultrasound transducer; WT, water tank; OL, objective lens; SCL, spherical conical lens. The images are reproduced with permission from [31,39].

