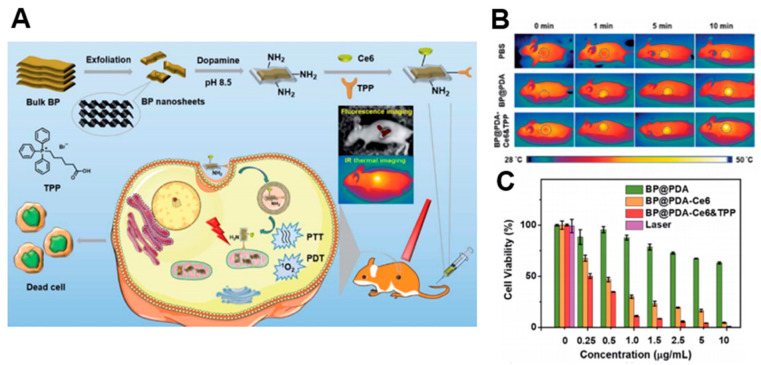
Figure 6.
(A) Schematic illustrations of the preparation, therapeutic uses, and peaks in functions of BP@PDA–Ce6&TPP NSs. (B) Ex vivo fluorescence imaging of main organs as well as tumor at 24 h post-injection. (C) Relative viabilities of HeLa cells incubated with BP@PDA NSs, BP@PDA–Ce6 NSs, and BP@PDA–Ce6&TPP NSs at different BP@PDA concentrations with laser illumination (660 nm, 0.5 W cm−2, 5 min). Data represent mean ± SD (n = 4). The images are reproduced with permission from [104].

