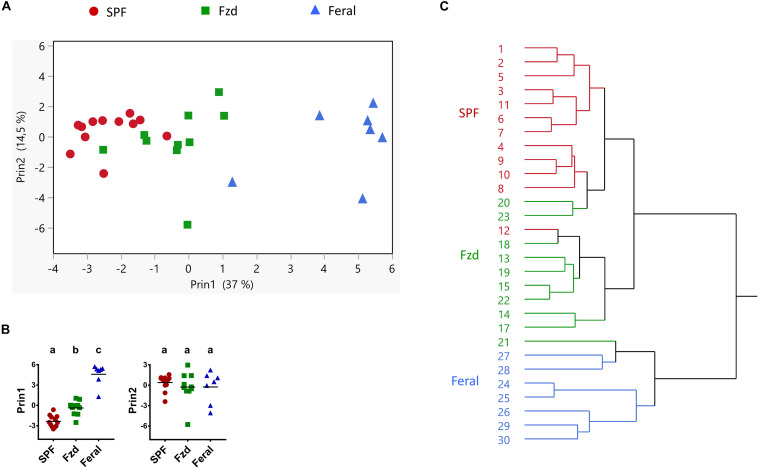
FIGURE 10.
Multivariate analyses of immune parameters showed that feralized mice clustered in the direction of feral mice. Presented data is from Exp. 2. (A) Principal coordinate analysis of Ln transformed values of variables listed in Supplementary Table S3. (B) Post-PCA analysis of the two first PCA variables (Prin1 and Prin2) using Tukey-Kramer’s multiple comparison for all groups. Different letters designate statistical significance with alpha level 0.05. (C) Hierarchical cluster analysis, numbers refer to individual mouse IDs. Fzd = Female B6 feralized with female feral mice.

