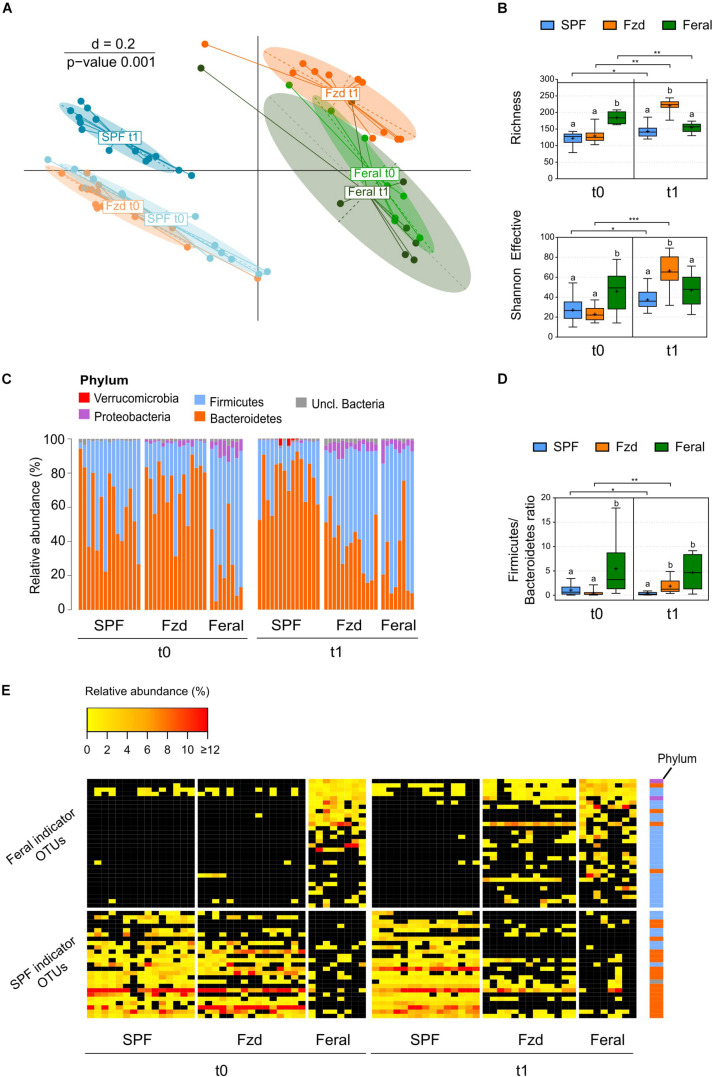
FIGURE 3.
Feralization lead to a gut microbiota diversity and composition converging with feral mice. Presented data is from Exp. 2. (A) Multi-dimensional scaling (MDS) plot of microbiota profiles for feral, feralized (Fzd) and SPF mice at baseline (t0) and termination (t1). Similarities between profiles were computed using generalized Unifrac distances. The significance of separation between groups was tested by PERMANOVA. d = dissimilarity scale. (B) Richness (observed OTUs) and Shannon effective diversity index. Box plots show median (line), mean (+), IQR (box) and minimum to maximum (whiskers). Asterisks designate over-time differences determined by Wilcoxon Signed-Rank Sum test. Differences between groups at each timepoint were determined by Kruskal-Wallis and Mann-Whitney U-tests. The Benjamini-Hochberg method was used to correct for multiple testing. Levels not sharing the same letter were significantly different at α = 0.05. ∗p ≤ 0.05, ∗∗p ≤ 0.01, ∗∗∗p ≤ 0.001. (C) Taxonomic binning at the rank of phylum, presented as relative abundance for each individual, with groups and timepoints indicated. (D) Firmicutes/Bacteroidetes ratio presented as in (B). (E) Heatmap of relative abundance of Feral- and SPF-associated OTUs identified by indicator species analysis. Phyla of which the OTUs belong to are designated with colored squares specified in (C). Relative abundances of the OTUs < 0.25% were set to NA (black). All plots: n = 8 (feral) or n = 13–15 (other groups).

