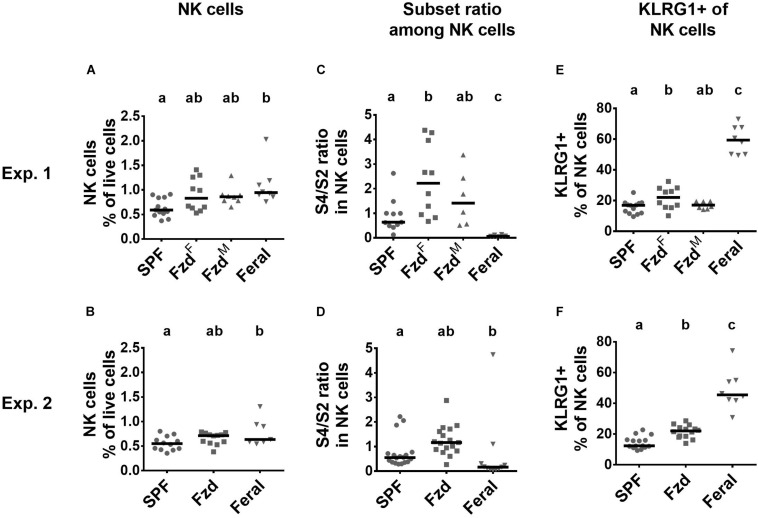
FIGURE 7.
Natural killer (NK) cells in feralized mice showed signs of maturation. Maturational subsets were defined as shown in Supplementary Figure S1, with subset ratio calculated based on CD27+CD11b– (S4)/CD27–CD11b+ (S2). Data from Exp.1 and 2 is shown respectively as follows: (A,B) Relative numbers of NK cells as per cent of live cells; (C,D) Ratio of S1/S2 subsets of NK cells within NK cells; (E,F) Proportion of NK cells expressing KLRG1. Abbreviations and statistics as in Figure 4.

