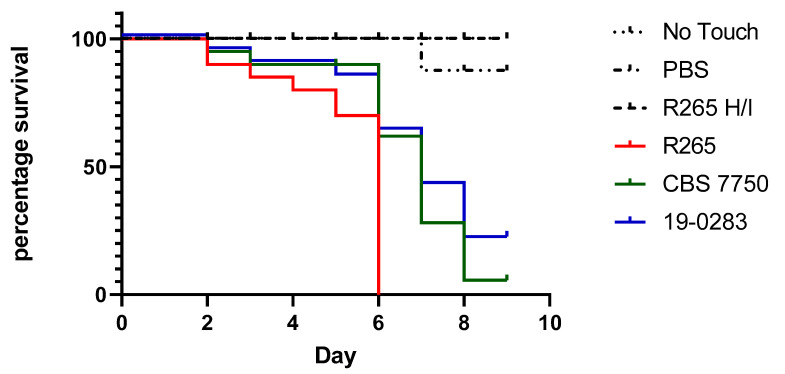
Figure 3.
Kaplan–Meyer survival curves of Galleria mellonella larvae injected with different C. gattii complex isolates and controls (20 larvae per group and experiment). The isolate from Bolivia (19-0283) is represented by the blue line, while C. gattii VGII reference strains R265 (high virulence) and CBS 7750 (low virulence) are shown as red and green lines, respectively. Control groups were either non-manipulated larvae (No Touch), or larvae injected with PBS or heat-inactivated (H/I) R265 (black dotted lines). The graph and statistical analysis were performed in Graphpad prism 8.4. The figure represents one of three biological replicates demonstrating equal outcomes.

