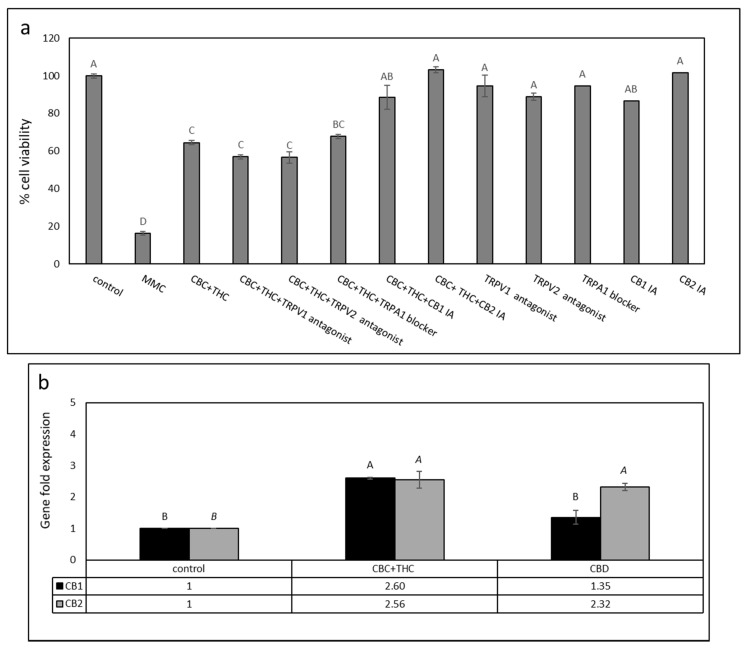
Figure 3.
(a) Cell viability of T24 cells treated with CBC+THC (11.5 + 2.0 μg/mL, respectively) with or without CB1, CB2 inverse agonists (IA), TRPV1 or TRPV2 antagonists, or a TRPA1 blocker (10 µM). Cell viability was determined by XTT assay. Mitomycin-C (MMC, 8 µg/mL) served as a positive control. Methanol (control) treatment served as a solvent (vehicle) control. Error bars indicate ± SE (n = 3). Levels with different letters of the same font are significantly different from all combinations of pairs according to the Tukey–Kramer honest significant difference (HSD). (b) Quantitative PCR determination of the RNA steady state level in T24 cell line of CB1 receptor (CNR1) or CB2 receptor (CNR2) genes, after treatment with CBC + THC (11.2 + 1.8 μg/mL, respectively) or CBD (9.2 μg/mL) for 6 h relative to control. Methanol (control) treatment served as a solvent (vehicle) control. Gene transcript values were determined by quantitative PCR as a ratio between the target gene versus a reference gene (HPRT1; geneID 3251). Values were calculated relative to the average expression of target genes in treated versus control using the 2ΔΔCt method.

