Figure 4.
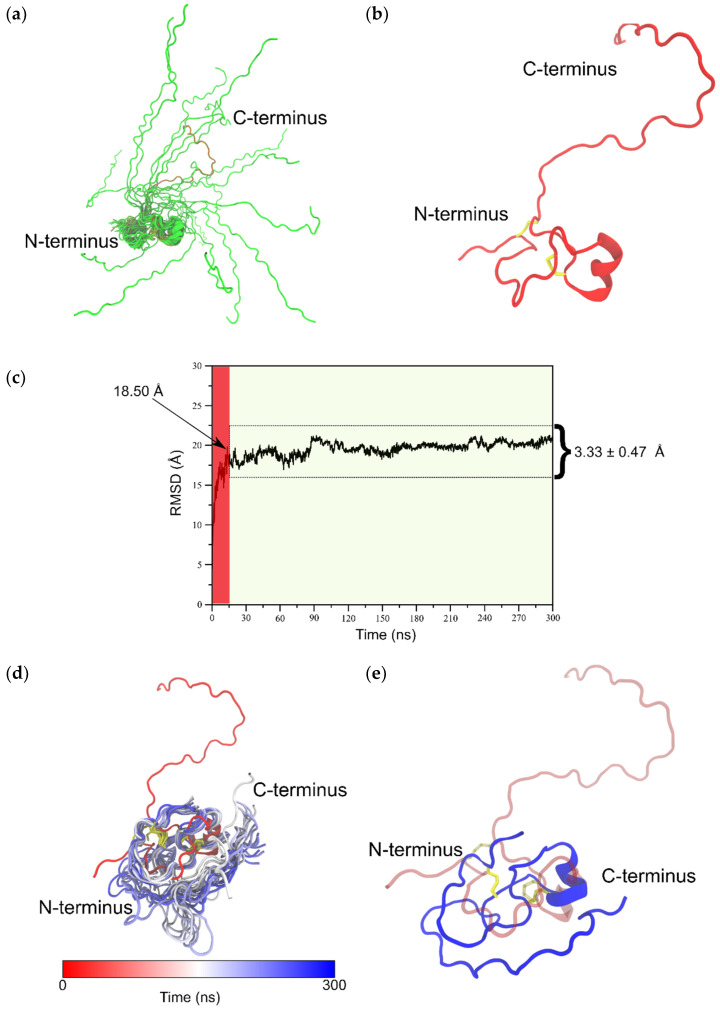
(a) Figure depicts 20 structures (green cartoons) from the 100-member NMR ensemble of full-length isomer B[C19S,C25S] [29] aligned on the N-terminal residues (1–37). The lowest energy model 1 is shown as red cartoons. (b) The lowest energy model from the NMR ensemble of isomer B[C19S,C25S] [29] used as input in the 300 ns molecular dynamics (MD) simulation. (c) Backbone root mean square deviation (RMSD) trace from the 300 ns MD simulation of isomer B[C19S,C25S] [29] with respect to its starting structure. The initial 15 ns of this simulation is considered as the equilibration phase (shaded red) and the remainder of the simulation (shaded green) is considered the production phase of the simulation. (d) Figure presents 20 equidistant structures from between 150 and 300 ns of the simulation as an ensemble (white to blue gradient cartoons) with the starting structure (red cartoon) shown as an indicator of the extent of structural change especially at the C-terminal (residues 38–66). (e) The final snapshot of the 300 ns MD simulation (blue cartoon) shown along with the starting structure (red transparent cartoon).

