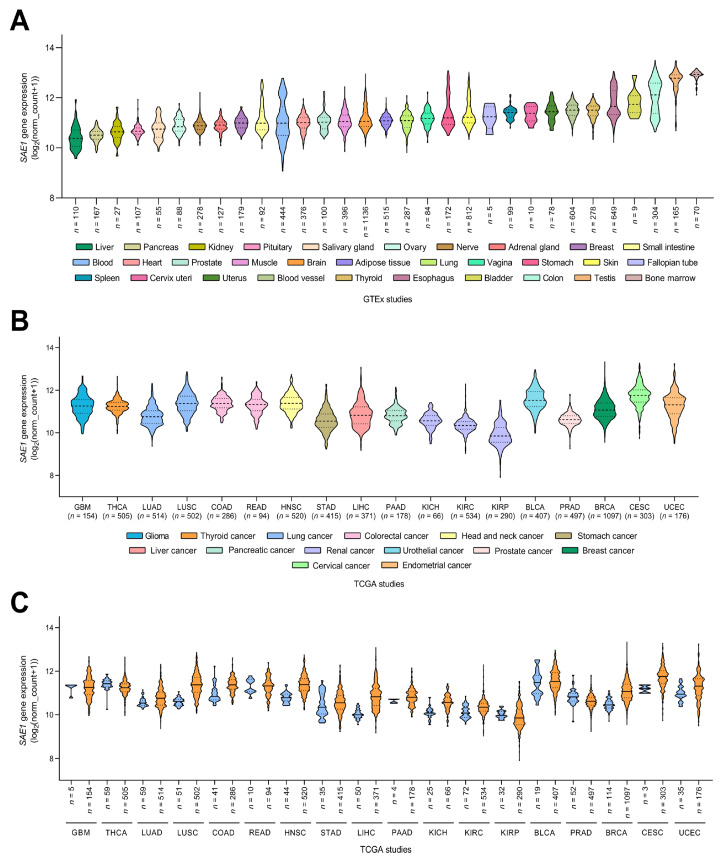
Figure 1.
Gene expression profile of SAE1 in Pan-Cancer cohort. Violin plots showing the mRNA expression levels of SAE1 in different human tissue types according to GTEx database (A), and in various human cancer types according to TCGA database (B). SAE1 expression levels in adjacent tumor (labeled in blue) and tumor samples (labeled in orange) according to TCGA database (C).

