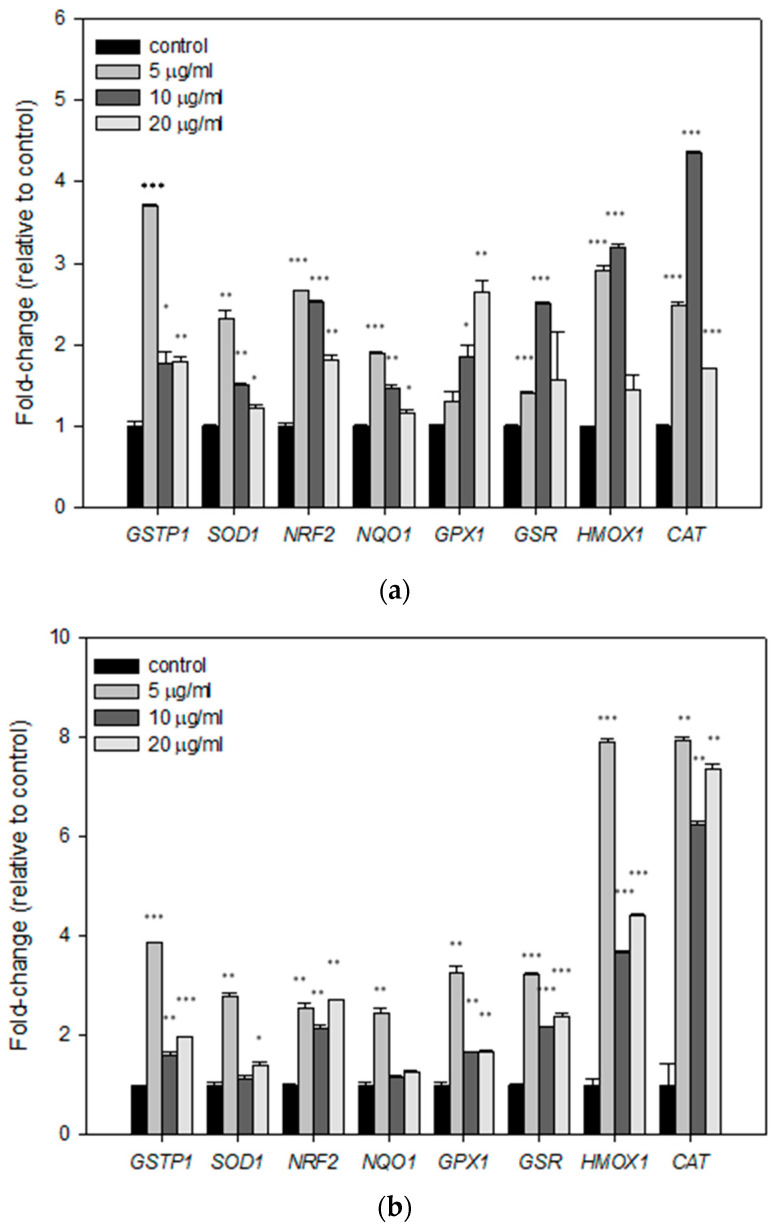
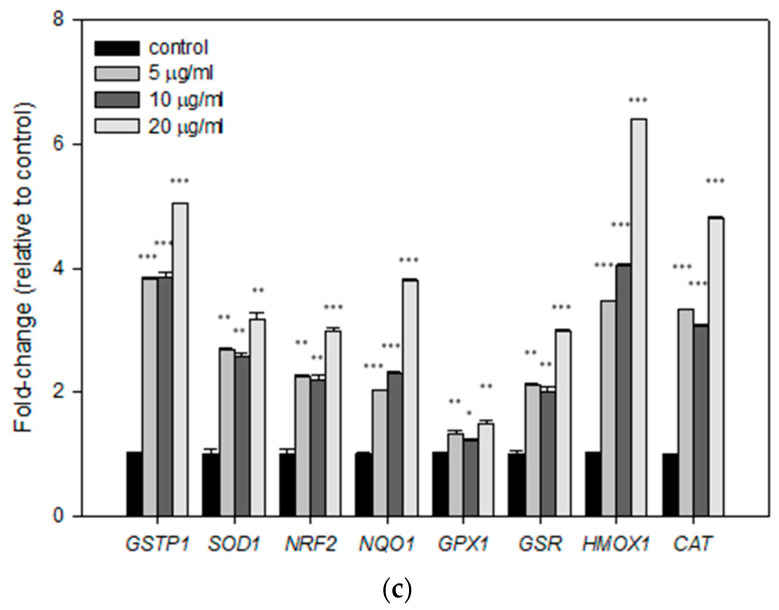
Figure 3.
Relative gene expression (mean fold change) of various antioxidant response genes in HaCaT cells treated for 24 h with (a) mastic essential oil and its major components, (b) myrcene and (c) α-pinene, as compared to non-treated cells. The comparative quantification method (ΔΔct) was used for the estimation of the fold change of gene expression. β-Actin was used as endogenous control to normalize samples. Representative figures of at least three experiments. Results are shown as mean ± SD. Note: * p < 0.05, ** p < 0.01, *** p < 0.001 vs. control (untreated cells).


