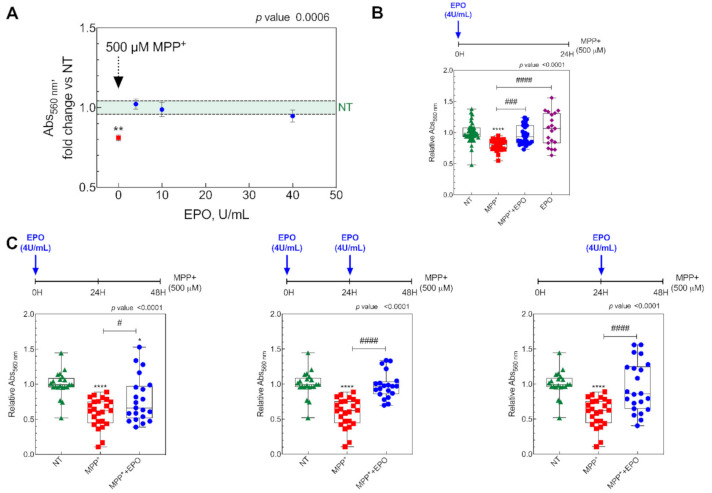
Figure 1.
In vitro results showing the effect of erythropoietin (EPO) on cell viability. (A) Cell viability in SH-SY5Y cells treated with 500 µM MPP+ (MPP+), and MPP+ plus 4, 10 and 40 U/mL EPO for 24 h. Data are expressed as mean ± SEM of 8 replicate values in 3 independent experiments (n = 24) and results are represented as percent of non-treated (NT), shown as the light green area. ** p < 0.01 vs. NT. (B) Cell viability in SH-SY5Y cells (NT), cells treated with 500 µM MPP+ (MPP+), cells treated 500 µM MPP+ + EPO 4U/mL (MPP+ + EPO) and cells treated with 4U/mL EPO (EPO). Data are expressed as box-and-whisker plot of 8 replicate values in 3 independent experiments (n = 24). Data are represented as a fraction over non-treated (NT). **** p < 0.0001 vs. NT; ### p < 0.001, #### p < 0.0001 vs. MPP+. (C) Effect of 4U/mL EPO on cell viability during 48 h MPP+ treatment. Viability was evaluated after 48 h in the three different experimental conditions in which EPO was administered at three different time points as reported in the timeline above each graph. Data are expressed as box-and-whisker plot of 8 replicate values in 3 independent experiments (n = 24) and results are represented as fraction over NT values. * p < 0.05, **** p < 0.0001 vs. NT; # p < 0.05, #### p < 0.0001 vs. MPP+.

