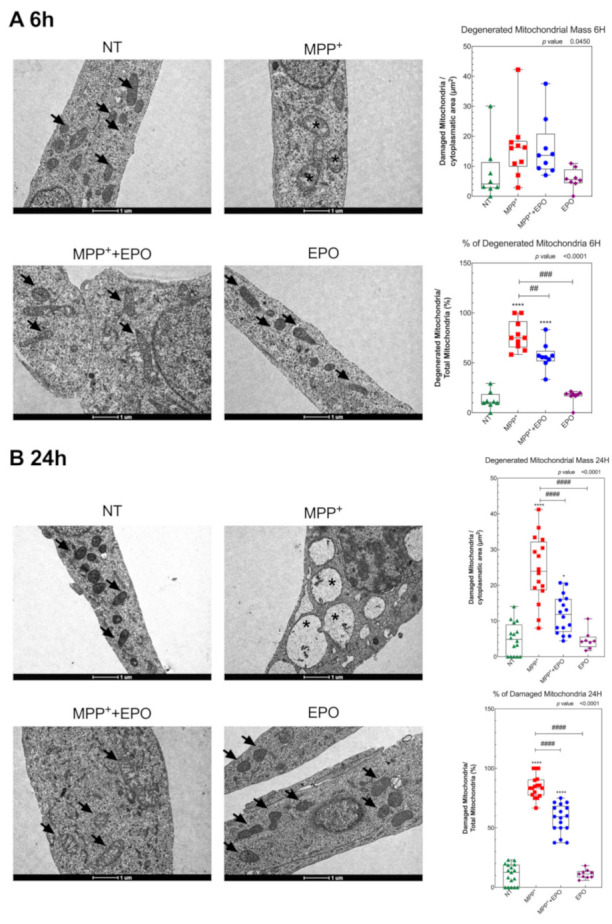
Figure 5.

EPO promotes the preservation of mitochondria ultrastructure. Transmission electron microscopy micrographs showing a portion of cytoplasm of SH-SY5Y cells (NT), after 6 h (A) and 24 h (B) treatment with MPP+, MPP+ + EPO or EPO. Arrows indicate healthy mitochondria and asterisks indicate mitochondria with strong signs of damage (disruption of cristae architecture and reduced matrix density). Scale bars = 1 µm. Data reported in the histogram refer to the box and whisker plot of 8 area values in 1 experiment and results are represented as percent of NT. * p < 0.05, **** p < 0.0001 vs. NT; ## p < 0.01, ### p < 0.001, #### p < 0.0001 vs. MPP+.
