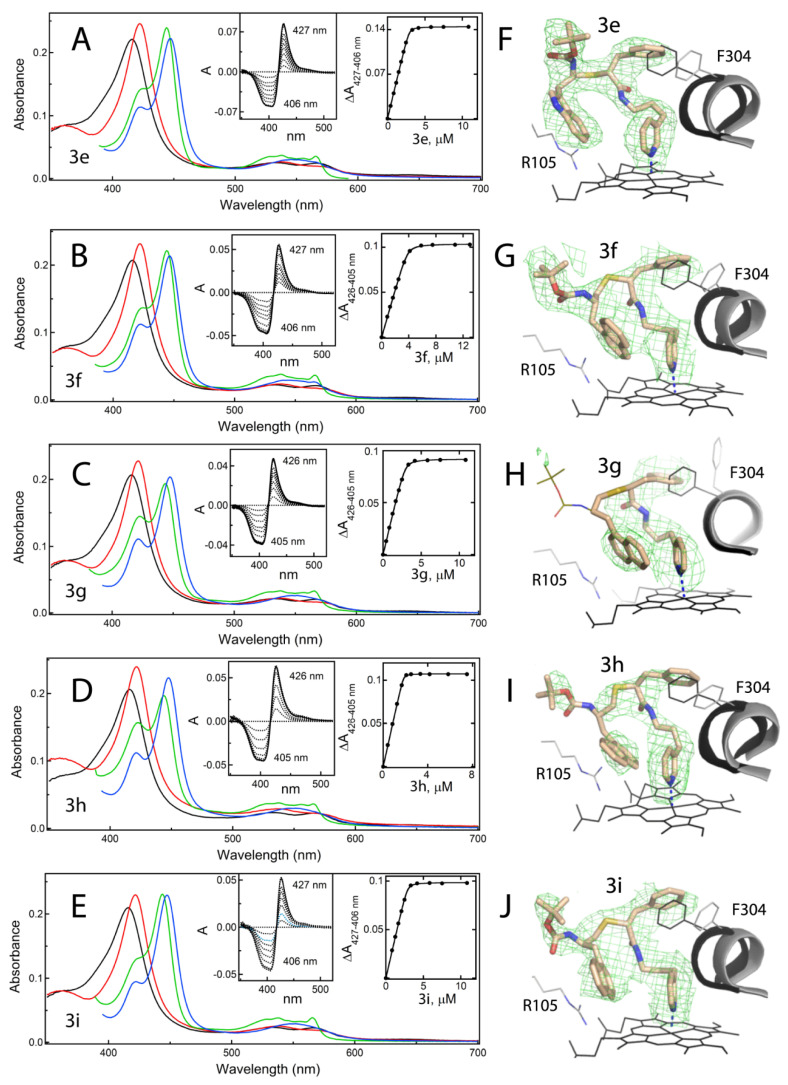
Figure 6.
Spectral properties and binding orientations of 3e–i. (A–E) Spectral changes induced in CYP3A4 by 3e–i. Absorbance spectra of ferric ligand-free and inhibitor-bound CYP3A4 are in black and red, respectively. Spectra of ferrous ligand-bound CYP3A4 and its CO-adduct are in green and blue, respectively. Left insets are the difference spectra recorded during equilibrium titrations; right insets are titration plots with quadratic fittings. The derived Ks values are listed in Table 1. (F–J) The binding modes of 3e–i observed in the crystal structures. Carbon, oxygen, nitrogen and sulphur atoms are shown in beige, red, blue and yellow, respectively. The adjacent I-helix and F304 in the inhibitory complexes and water-bound CYP3A4 (5VCC structure) are depicted in gray and black, respectively. Polder omit maps contoured at 3σ level are shown as green mesh. The disordered tail of 3g is shown as thin lines.

