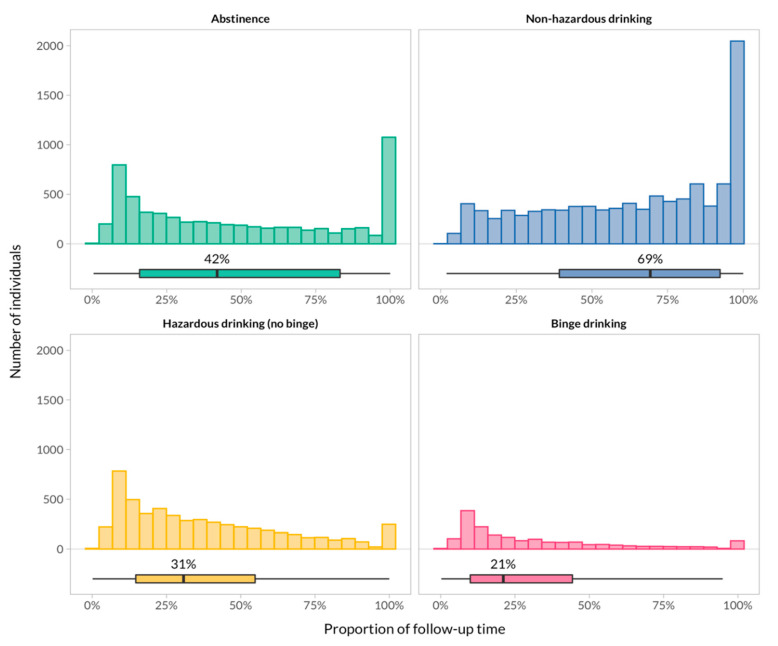
Figure 2.
Distribution of the proportion of follow-up time spent in each category at the individual level. Histograms and boxplots show the distribution and summary of participants’ contribution to follow-up time in each category. Individuals who reported hazardous or binge drinking remained in this category for a median of 31% and 21% of their follow-up, respectively. A substantial proportion of individuals (large bars on the right) who contributed to the abstaining or non-hazardous drinking category stayed in that same category for 100% of their follow-up.

