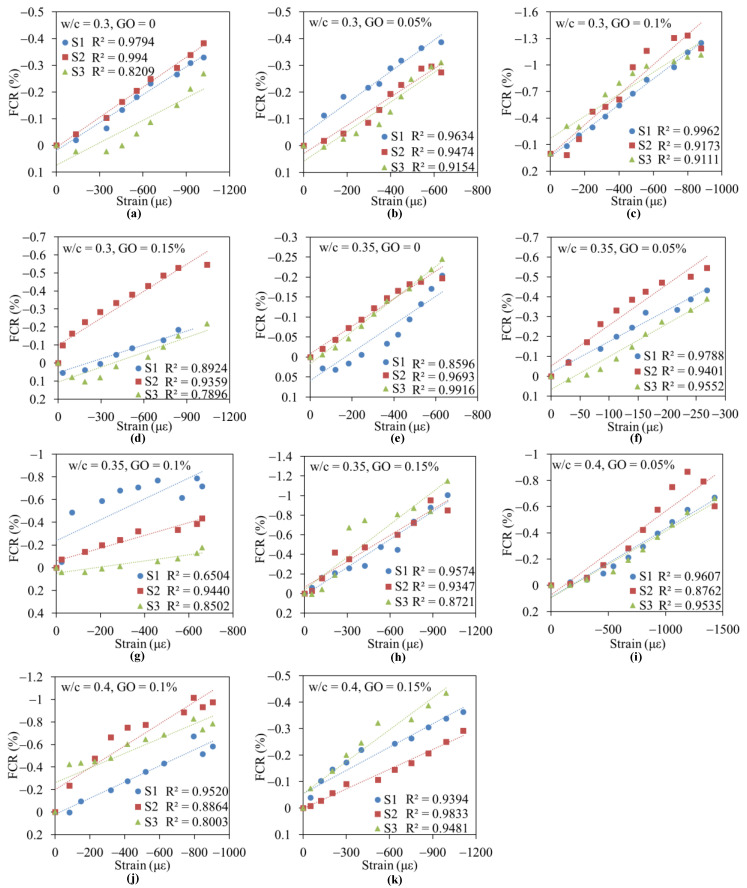
Figure 3.
Corresponding changes in resistance of GO/CC under different strains for specimens at different w/c: (a) w/c = 0.3, GO = 0; (b) w/c = 0.3, GO = 0.05%; (c) w/c = 0.3, GO = 0.1%; (d) w/c = 0.3, GO = 0.15%; (e) w/c = 0.35, GO = 0; (f) w/c = 0.35, GO = 0.05%; (g) w/c = 0.35, GO = 0.1%; (h) w/c = 0.35, GO = 0.15%; (i) w/c = 0.4, GO = 0.05%; (j) w/c = 0.4, GO = 0.1%; (k) w/c = 0.4, GO = 0.15%.

