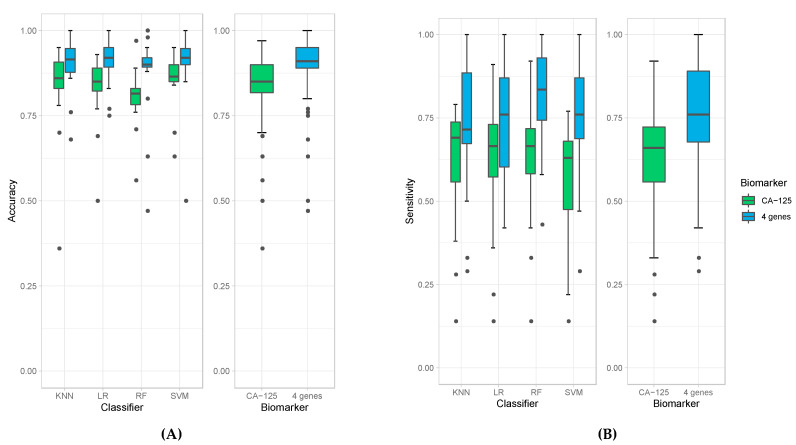
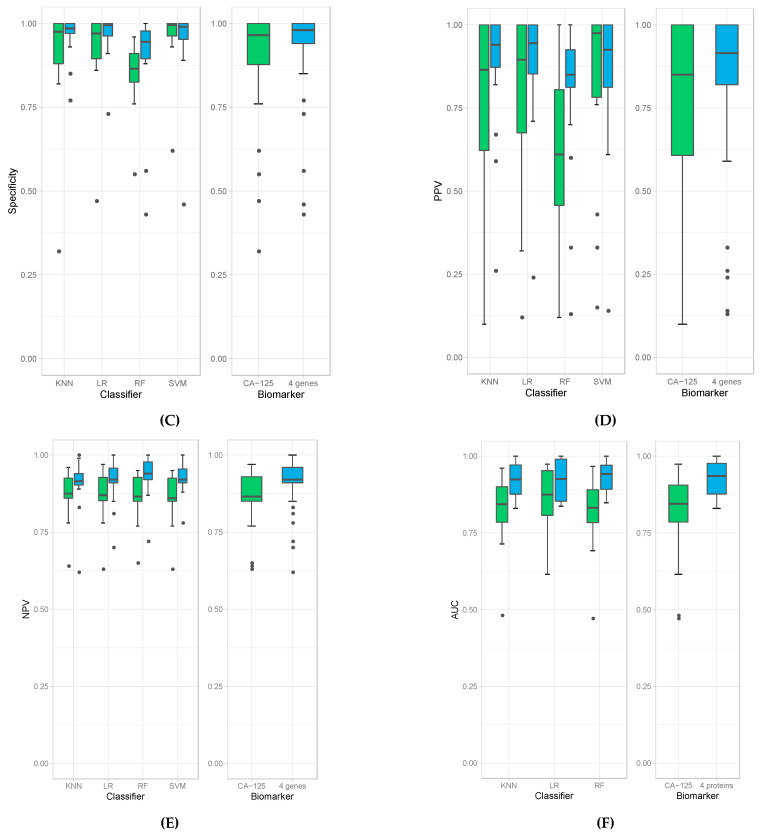
Figure 1.
Box plots of accuracies (A), sensitivities (B), specificity (C), PPV (D), NPV (E), and AUC (F) obtained by individual classifiers (left panel), namely K-Nearest Neighbor (KNN), Logistic Regression (LR), Random Forest (RF), and Support Vector Machine (SVM), and average accuracies of all models (right panel) when using CA-125 alone (green bars) and using all four genes (blue bars).


