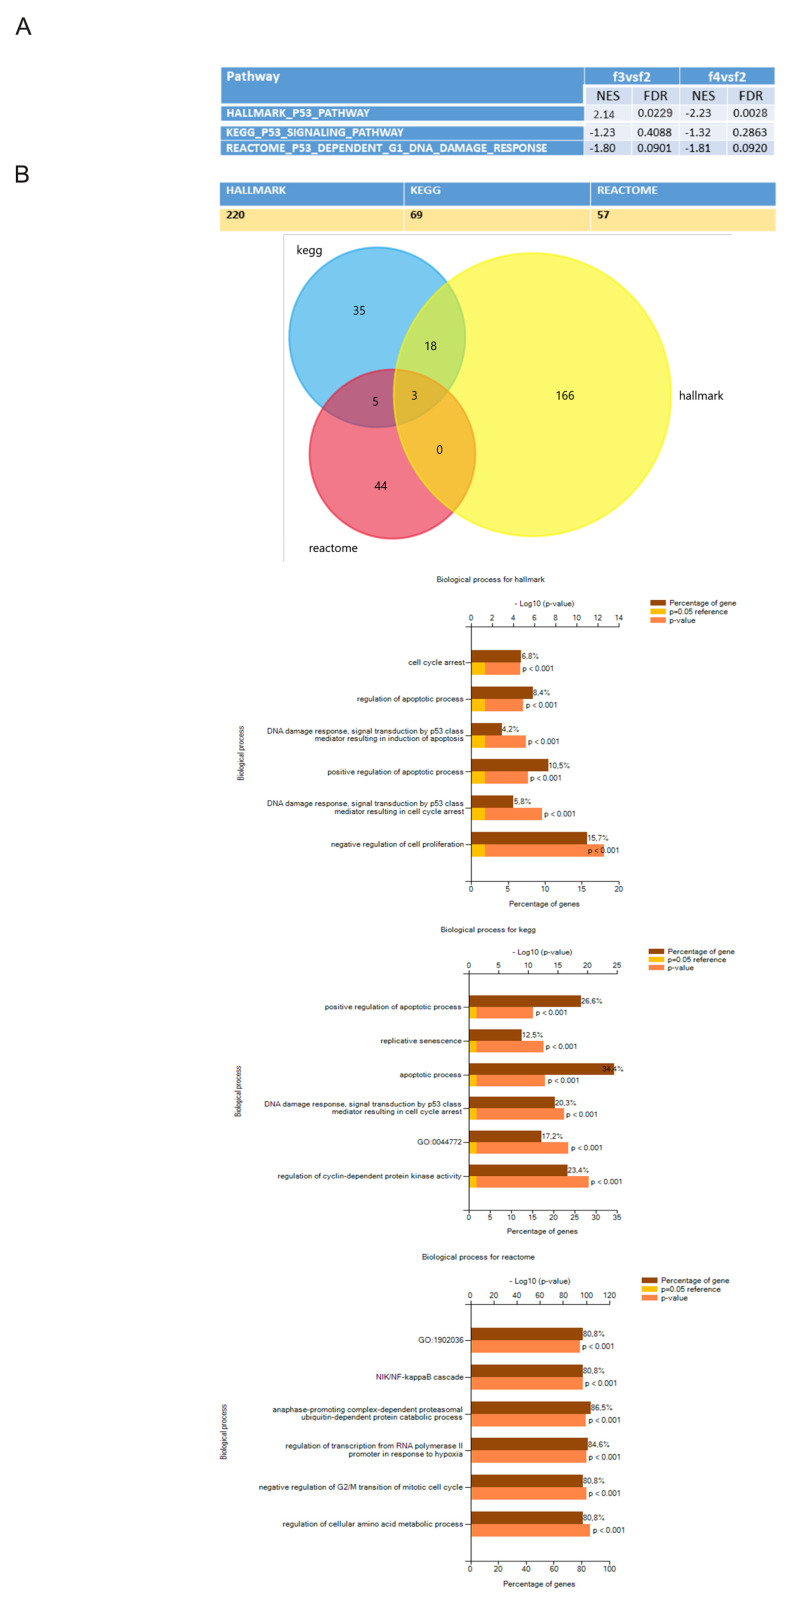
Figure 4.
Evaluation of p53 pathway expression in different datasets. (A) Differential expression of p53 pathway in F3/F4 fractions versus F2 according to Hallmark, Kegg and Reactome. The table reports the Normalized Enrichment score (NES) and the False discovery rate value (FDR). (B) In the table above the number of genes of each dataset is reported. The bar graphs show at which biological processes genes composing each dataset can be ascribed. In particular, the brown bar shows the percentage of genes belonging to each biological process, the yellow bar shows the reference—log10 p value and the orange bar reports the—log10 p value of each process.

