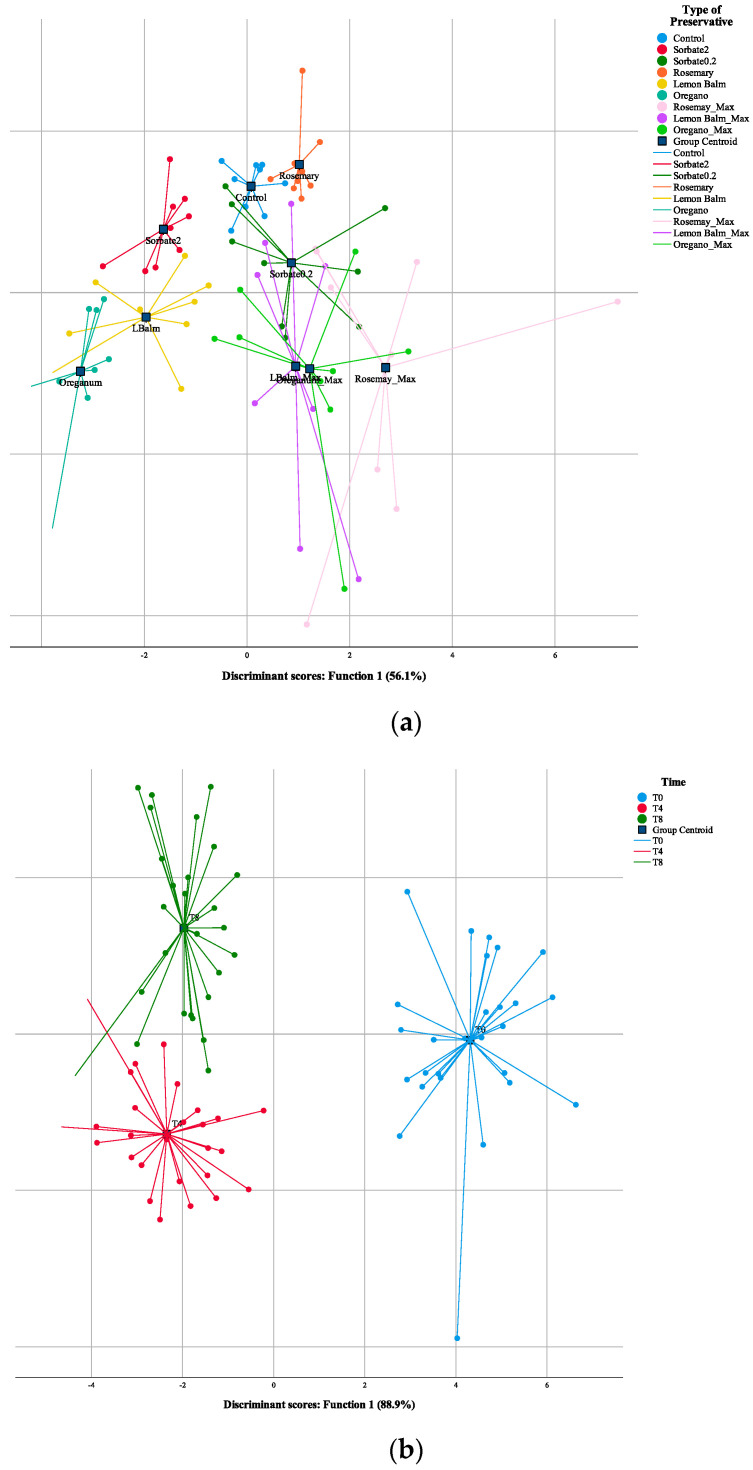
Figure 3.
Spatial distribution of type of preservative (TP) (a) and storage time (ST) (b) markers following the distribution set by the canonical discriminant functions coefficients. For TP, Function 1 accounted for 56.1% of the variation and Function 2 accounted for 17%. Combined, these two functions accounted for 73.1% of the variation, with another 4 functions necessary to account for 100%. Regarding ST, Function 1 accounted for 88.9% of the variation and Function 2 accounted for 11.1%, together accounting for 100% of the variation of the factor.

