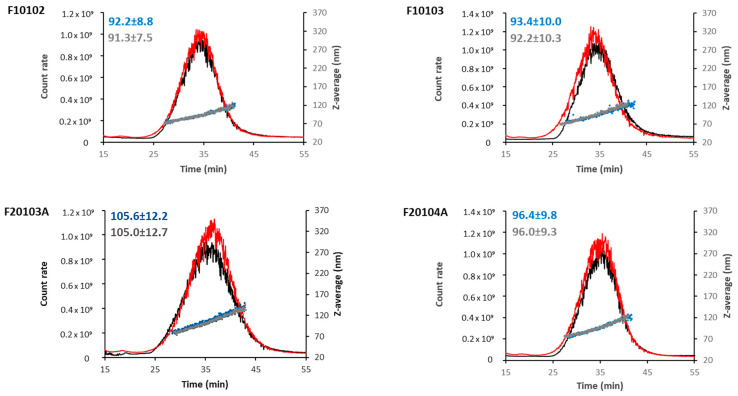
Figure 3.
AF4-DLS measurements of selected liposomes in PBS (black lines and blue dots) or PBS supplemented with 10% human serum (red lines and grey dots). The elugram of flow mode DLS (scattered intensity and size vs. elution time) are reported for one representative measurement for each selected liposome and condition. Scattering intensity peaks (lines) and hydrodynamic diameters (dots) by DLS are shown. Hydrodynamic diameter values, measured in PBS or in serum, are reported (blue and grey respectively).

