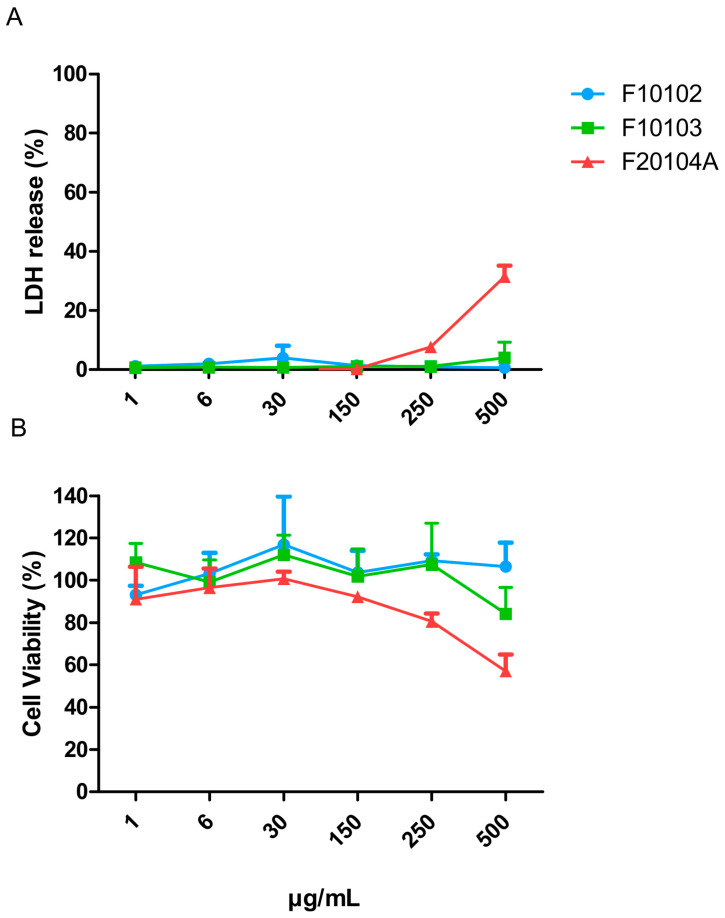
Figure 5.
Cell death (% LDH release; A) and cell viability (% MTT metabolic transformation; B) of Hep G2 cells exposed to liposomes F10102, F10103 and F20104A for 24 h. The error bars represent the SD of three independent experiments. Negative controls (incubation in medium) and positive controls (cell lysis with Triton) were used as benchmarks.

