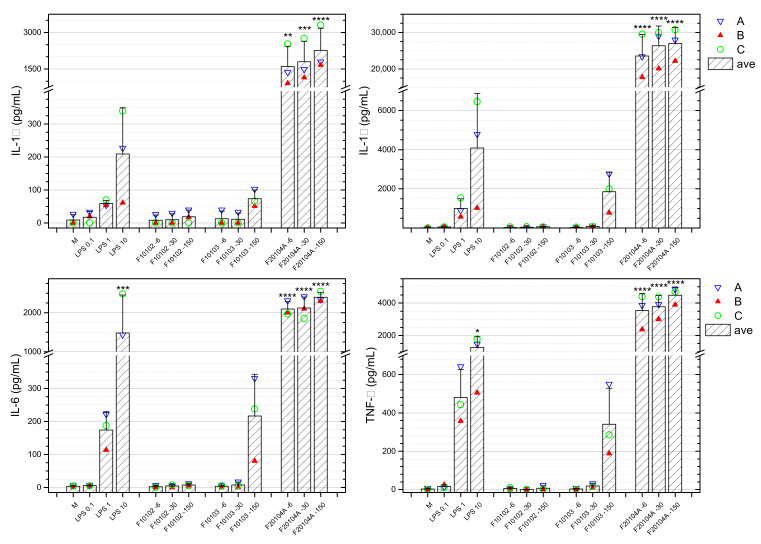
Figure 8.
Whole blood from three healthy donors (represented in blue, red, green) was incubated for 24 h with selected liposomes at three concentrations (6, 30, 150 μg/mL). The production of IL-1α, IL-1β, IL-6, and TNF-α data is here reported. M represents the negative control (whole blood exposed to medium only), whereas LPS was used as a positive control at the concentrations of 0.1, 1 and 10 ng/mL. Data are also shown as mean (shaded bars) ± SD. * p < 0.05, ** p < 0.01, *** p < 0.001, **** p < 0.0001.

