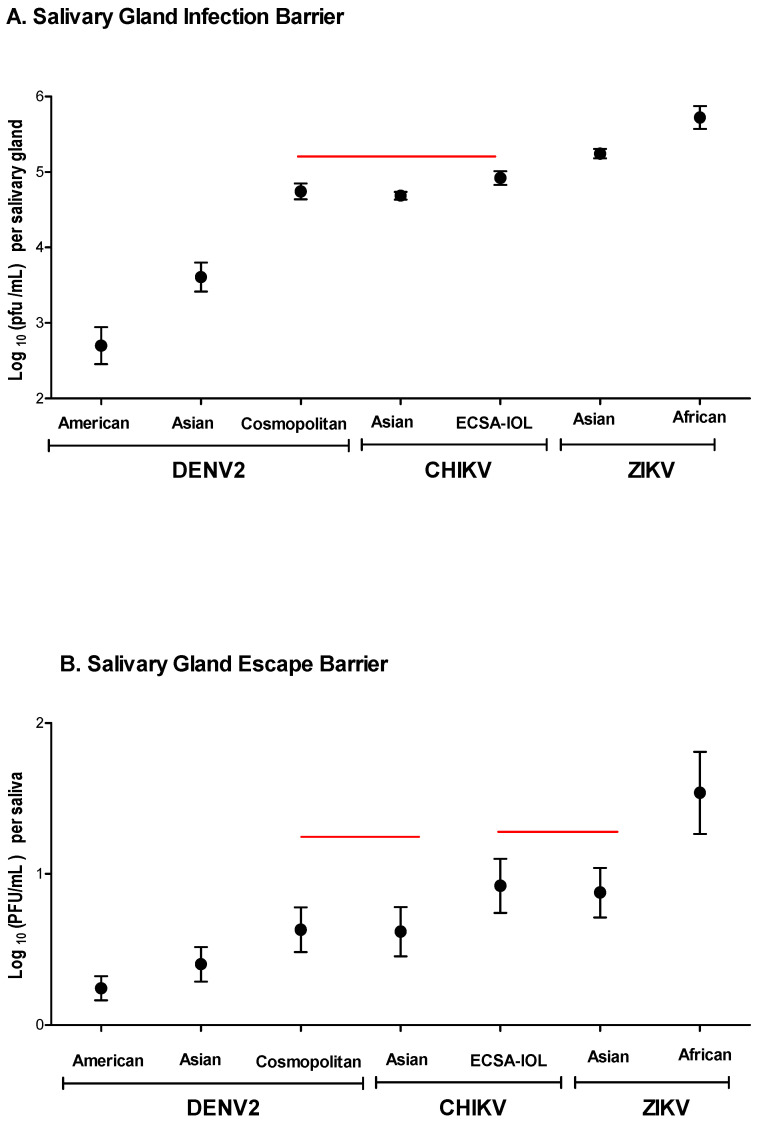
Figure 5.
(A) Average numbers of log10 (PFU/mL) per salivary gland for all seven viral genotypes. (B) Average numbers of log10 (PFU/mL) per saliva were calculated for all seven viral genotypes. Horizontal lines over pairs of genotypes in either graph indicate that average log10 (PFU/mL) per salivary gland did not differ significantly.

