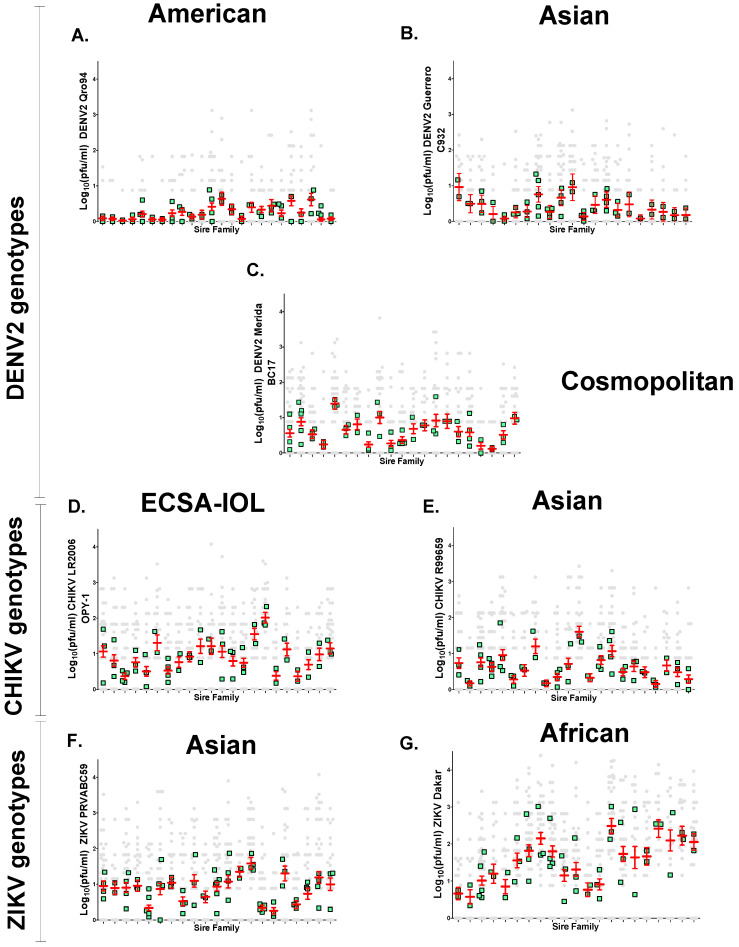
Figure 8.
Distribution of phenotypes log10 (PFU/mL) per saliva in half-sib families for the seven virus strains. Each column of points arising from the X-axis represents a sire family. In each column, the distribution of individual saliva titer arising from that sire appear as gray circles. Mean sire values and their 95% confidence intervals are displayed in red. The mean of dam families in each sire appear in green. (A) DENV2 American genotype, (B) DENV2 Asian genotype, (C) DENV2 Cosmopolitan genotype, (D) CHIKV ESCA-IOL genotype, (E) CHIKV Asian genotype, (F) ZIKV Asian genotype, and (G) ZIKV African genotype.

