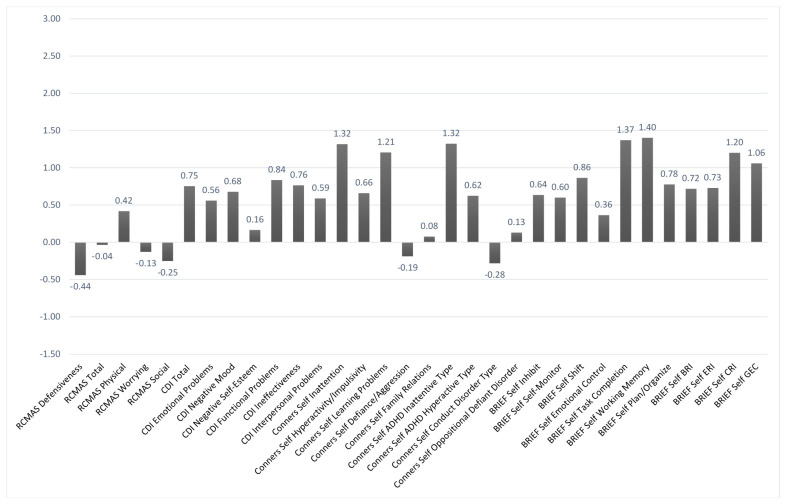
Figure 2.
Behavioral Self-Report Baseline Data. n = 17. The y-axis is based on z-scores (M = 0, SD = +/−1). Higher scores indicate the reporting of greater problem. Revised Child Manifest Anxiety Scale (RCMAS); Child Depression Inventory (CDI); Behavior Rating Inventory of Executive Functioning (BRIEF); Behavior Regulation Index (BRI); Emotion Regulation Index (ERI); Cognitive Regulation Index (CRI); Global Executive Composite (GEC).

