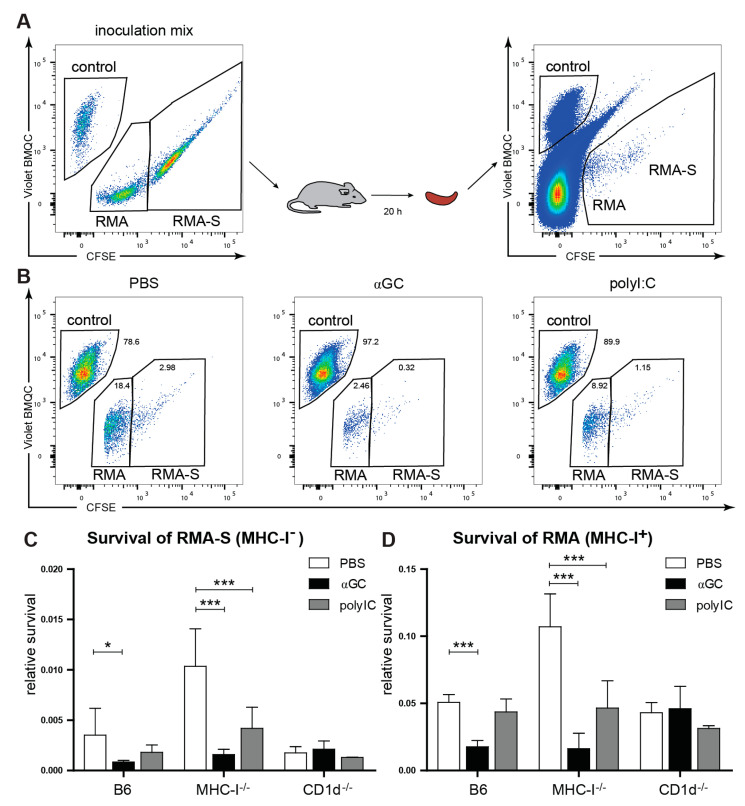
Figure 5.
Increased anti-tumor responses after αGC-treatment. C57Bl/6, MHC-I−/− or CD1d−/− mice were injected i.v., with PBS, αGC or polyI:C. 3 days after in vivo stimulation, survival of MHC-I+ RMA (labeled with 0.5 uM CFSE) or MHC-I− RMA-S (labeled with 5uM CFSE) tumor target cells was tested in reference to Violet BMQC-labeled MHC-I+ splenocytes (control) (A). Relative survival of MHC-I+ RMA or MHC-I− RMA-S cells (B–D) was assessed by comparing the frequency of remaining target cells to an inert control cell population (NK1.1-depleted B6 spleen cells), as explained in Materials and Methods. (B) shows representative flow cytometry plots for B6 mice treated with PBS, αGC or poly-I:C. (C) The relative survival of remaining MHC-I− target cells and (D) the relative survival of MHC-I+ target (D) are shown. (C,D) A total of 6–8 mice per group were tested (compiled from 2 independent experiments). Error bars denote SD. Significant differences were calculated within each mouse strain by one-way ANOVA with Dunnett’s correction for multiple testing and are denoted * p < 0.05, *** p < 0.001.

