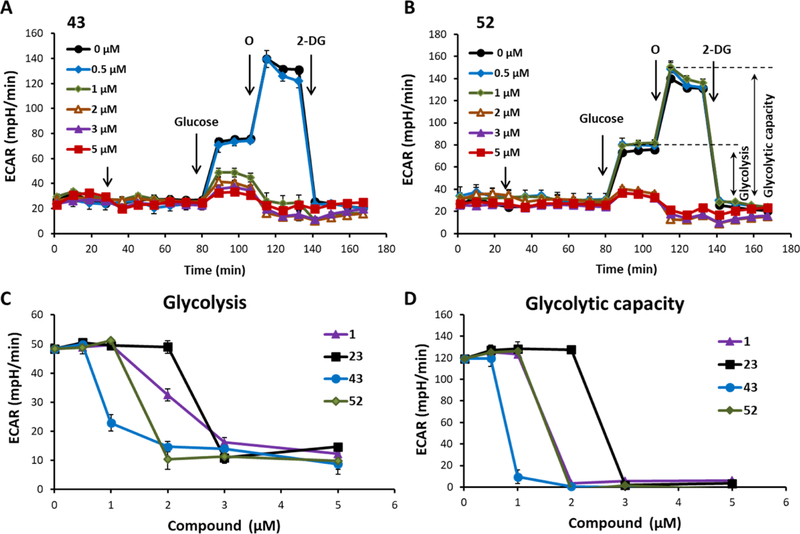
Figure 3.
LDH inhibitor-dependent suppression of glycolytic flux in A673 cells. The GST was performed in A673 cells to measure the ECAR over time; cellular basal ECAR was measured and then compound 43 (panel A) or 52 (panel B) was injected at increasing concentrations. After 48 min, subsequent injections of glucose (10 mM; glycolysis), oligomycin (1 μg/mL) (O; reaching maximal glycolytic capacity), and 2-deoxyglucose (50 mM) (2-DG; inhibition of glycolysis) were made. (C) Quantification of the glycolysis (ECAR after glucose injection minus basal ECAR) and (D) quantification of the glycolytic capacity of the LDHA inhibitors, 43 and 52, in a dose–response manner in comparison with compounds 1 and 23. Data represent the mean ± standard error of the mean, n = 4–6 per group. All LDH inhibitors completely suppressed both basal and maximal glycolysis between 1 and 3 μM, with 43 and 52 being the most potent and 23 the least.

