Table 2.
Biochemical and Cellular LDH Inhibition of Analogues 11–49
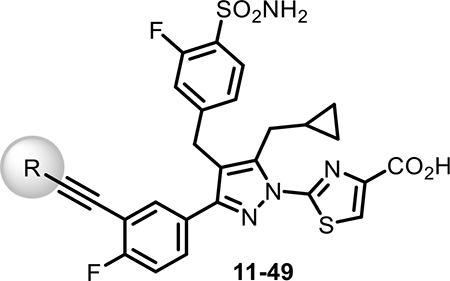 | |||||||
|---|---|---|---|---|---|---|---|
| Compd No. |  |
Biochemical LDHA IC50 (nM)a | A673 cells |
MiaPaCa-2 cells |
HEK293 Cells |
||
| lactate inh. IC50 (nM)a | Cytotox. IC50 (nM)a | lactate inh. IC50 (nM)a | Cytotox. IC50 (nM)a | CETSA IC50 (nM)a | |||
| 11 | H | 9 | 902 | 4346 | 660 | 4025 | 253 |
| 12 | CH3 | 11 | 505 | 332 | 450 | 322 | 119 |
| 13 | Et | 14 | 487 | 716 | 470 | 662 | 112 |
| 14 | n-Pr | 24 | 420 | 833 | 361 | 746 | 106 |
| 15 | n-Bu | 50 | 405 | 773 | 298 | 845 | 106 |
| 16 | 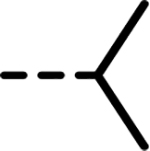 |
21 | 284 | 1011 | 487 | 756 | 2053 |
| 17 | 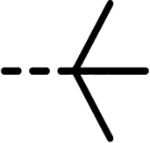 |
16 | 141 | 935 | 137 | 845 | 75 |
| 18 | 3 | 2475 | 1798 | 1659 | 1327 | 577 | |
| 19 | 8 | 769 | 1225 | 525 | 1092 | 119 | |
| 20 |  |
54 | 284 | 935 | 487 | 909 | 89 |
| 21 | 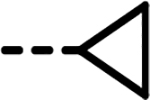 |
9 | 695 | 132 | 554 | 323 | 100 |
| 22 | 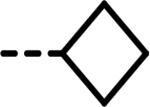 |
23 | 378 | 593 | 428 | 573 | 133 |
| 23 |  |
22 | 509 | 100 | 333 | 314 | 112 |
| 24 |  |
33 | 450 | 689 | 454 | 593 | 95 |
| 25 |  |
7 | 1931 | 2187 | 1479 | 2178 | 150 |
| 26 |  |
10 | 1052 | 1177 | 898 | 1236 | 84 |
| 27 |  |
7 | 1324 | 2647 | 1047 | 2263 | 126 |
| 28 |  |
6 | 12241 | 3587 | 4873 | 2994 | 1499 |
| 29 |  |
7 | 1268 | 973 | 831 | 1224 | 89 |
| 30 |  |
1 | 1056 | 1054 | 867 | 882 | 201 |
| 31 |  |
5 | 5937 | 2635 | 3871 | 1738 | 815 |
| 32 |  |
15 | 12241 | 9052 | 8910 | 17302 | 2579 |
| 33 | CN | 15 | 4010 | >30000 | 4401 | >30000 | 474 |
| 34 | CF3 | 450 | >30000 | >30000 | >30000 | >30000 | 14005 |
| 35 | CF2H | 15 | 937 | 1482 | 741 | 1327 | 163 |
| 36 | 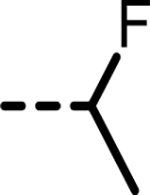 |
14 | 800 | 1134 | 822 | 1020 | 127 |
| 37 |  |
31 | 234 | 1016 | 259 | 1030 | 89 |
| 38 |  |
202 | 487 | 939 | 424 | 848 | 178 |
| 39 |  |
8 | 1086 | 973 | 1007 | 1102 | 267 |
| 40 |  |
9 | 933 | 1380 | 937 | 1225 | 178 |
| 41 |  |
107 | 15349 | 5834 | 18852 | 18061 | 5045 |
| 42 |  |
32 | 438 | 265 | 307 | 268 | 89 |
| 43 (NCATS-SM1440) |  |
57 | 873 | 119 | 403 | 257 | 106 |
| 44 |  |
47 | 544 | 528 | 547 | 552 | 79 |
| 45 |  |
713 | 529 | 743 | 507 | 665 | 10602 |
| 46 |  |
33 | 937 | 569 | 867 | 488 | - |
| 47 |  |
52 | 1324 | 803 | 1603 | 909 | 170 |
| 48 | 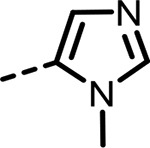 |
8 | 1597 | 1542 | 1066 | 1387 | 299 |
| 49 |  |
9 | 1603 | 593 | 1141 | 619 | 189 |
IC50 values represent the half maximal (50%) inhibitory concentration as determined in the HTS assay using a dose response in the 1536-well format. (n = 2 for lactate and n = 3 for cytotoxicity, CETSA, and biochemical LDHA.)
