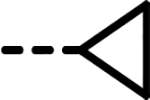
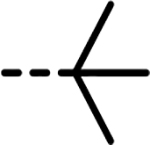
Table 4.
Biochemical and Cellular LDH Inhibition of Compounds 68–73
 | ||||||||
|---|---|---|---|---|---|---|---|---|
| Compd No. |  |
X | Biochemical LDHA IC50 (nM)a | A673 cells |
MiaPaCa-2 cells |
HEK293 Cells |
||
| lactate inh IC50 (nM)a | Cytotox IC50 (nM)a | lactate inh IC50 (nM)a | Cytotox IC50 (nM)a | CETSA IC50 (nM)a | ||||
| 68 |  |
H | 52 | 357 | 452 | 331 | 471 | 158 |
| 69 |  |
F | 74 | 371 | 488 | 149 | 454 | 108 |
| 70 |  |
F | 15 | 320 | 833 | 231 | 837 | 134 |
| 71 | CH3 | F | 11 | 405 | 614 | 321 | 528 | 126 |
| 72 |  |
F | 59 | 361 | 2263 | 255 | 1899 | 112 |
| 73 | - | - | 39 | 713 | 16023 | 972 | 17376 | 398 |
IC50 values represent the half maximal (50%) inhibitory concentration as determined in the HTS assay using a dose response in the 1536-well format. (n = 2 for lactate and n = 3 for cytotoxicity, CETSA, and biochemical LDHA.)
