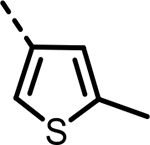
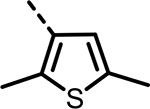
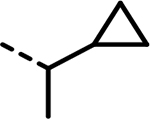
Table 5.
Biochemical and Cellular LDH Inhibition of Analogues 74–89
 | ||||||||
|---|---|---|---|---|---|---|---|---|
| Compd No. |  |
X | Biochem LDHA IC50 (nM)a | A673 cells |
MiaPaCa-2 cells |
HEK293 Cells |
||
| lactate inh IC50 (nM)a | Cytotox IC50 (nM)a | lactate inh IC50 (nM)a | Cytotox IC50 (nM)a | CETSA IC50 (nM)a | ||||
| 74 |  |
F | 202 | 390 | 218 | 197 | 226 | 200 |
| 75 |  |
H | 117 | 174 | 187 | 172 | 171 | 152 |
| 76 |  |
H | 52 | 547 | 137 | 417 | 137 | 95 |
| 77 |  |
H | 160 | 434 | 197 | 254 | 223 | 142 |
| 78 |  |
H | 306 | 434 | 320 | 387 | 265 | 189 |
| 79 |  |
H | 636 | 572 | 571 | 379 | 496 | 299 |
| 80 |  |
H | 33 | 364 | 180 | 417 | 173 | 84 |
| 81 |  |
H | 24 | 434 | 218 | 334 | 218 | 17756 |
| 82 |  |
H | 24 | 300 | 219 | 253 | 219 | 90 |
| 83 |  |
H | 487 | 162 | 402 | 188 | 402 | 299 |
| 84 |  |
- | 874 | 685 | 968 | 1027 | 9350 | 708 |
| 85 |  |
- | 4540 | 18264 | 5899 | 5144 | 7427 | 10751 |
| 86 |  |
- | 307 | 346 | 590 | 409 | 1049 | 251 |
| 87 |  |
- | 122 | 485 | 526 | 459 | 469 | 175 |
| 88 |  |
- | 1174 | 364 | 4686 | 515 | 5258 | 1027 |
| 89 |  |
- | 5270 | 1864 | 26351 | 1219 | 20931 | 3183 |
IC50 values represent the half maximal (50%) inhibitory concentration as determined in the HTS assay using a dose response in the 1536-well format. (n = 2 for lactate and n = 3 for cytotoxicity, CETSA, and biochemical LDHA.)
